Dog Cloning For Special Forces: Breed All You Can Breed
Decision analysis of whether cloning the most elite Special Forces dogs is a profitable improvement over standard selection procedures. Unless training is extremely cheap or heritability is extremely low, dog cloning is hypothetically profitable.
Cloning is widely used in animal & plant breeding despite steep costs due to its advantages; more unusual recent applications include creating entire polo horse teams and reported trials of cloning in elite police/Special Forces war dogs. Given the cost of dog cloning, however, can this ever make more sense than standard screening methods for selecting from working dog breeds, or would the increase in successful dog training be too low under all reasonable models to turn a profit?
I model the question as one of expected cost per dog with the trait of successfully passing training, success in training being a dichotomous liability threshold with a polygenic genetic architecture; given the extreme level of selection possible in selecting the best among already-elite Special Forces dogs and a range of heritabilities, this predicts clones’ success probabilities. To approximate the relevant parameters, I look at some reported training costs and success rates for regular dog candidates, broad dog heritabilities, and the few current dog cloning case studies reported in the media.
Since none of the relevant parameters are known with confidence, I run the cost-benefit equation for many hypothetical scenarios, and find that in a large fraction of them covering most plausible values, dog cloning would improve training yields enough to be profitable (in addition to its other advantages).
As further illustration of the use-case of screening for an extreme outcome based on a partial predictor, I consider the question of whether height PGSes could be used to screen the US population for people of NBA height, which turns out to be reasonably doable with current & future PGSes.
Military and police dogs are specially trained for their jobs. Only some dogs are up to the task, but like training seeing-eye guide dogs, it’s difficult to know in advance and many dogs will wash out of training as expensive failures, with even fewer being able to handle the extreme life of a Special Forces dog; then they may get injured on the job, develop hip dysplasia or cancer, cutting short their career, and leading to perennial shortages. This is despite the best efforts of the (mostly European) breeders who raise the Malinois, German Shepherd, Belgian Shepherd, and Labradors preferred for war dogs.
, provided by Byeong-Chun Lee; photo taken presumably 2007/–2008.")
The 7 Tomorrow Dogs/Toppies cloned in 200719ya.
In 201412ya, Bloomberg reported on an interesting aspect of Sooam Biotech, the famous South Korean dog cloning company: they were cloning a Special Forces dog. If it’s hard to be a K9, it’s even harder to be a SF dog, able to jump out of airplanes (they have special parachute harnesses), go on raids, carry cameras with them, even (reportedly) wear little doggie hoods with infrared camera goggles for night work; so valuable and specialized are such dogs that special $26,964.13$20,0002017 animatronic dog models like the “K9 Hero-Trauma” are sold to train medics how to treat injuries like gunshot wounds or amputations. If you have a successful SF dog… maybe the clone will be much more likely to succeed than a random puppy picked from one of the usual breeders, and you can make as many clones as necessary long after the original has gone to Dog Heaven.
Clones of elite individuals are increasingly common in agriculture; plants, like the myriads of apple varieties, have always been propagated clonally, but cloning of cattle has made major commercial inroads1—not just cloning of cattle for beef or cows for milk, but also clones of rodeo bulls (the logical extension of the highly successful selective breeding for rodeo bulls). A striking example of this approach is the world polo champion Adolfo Cambiaso, who is so enthusiastic about the benefits of horse cloning that he has cloned his prized polo horse not once but >10 times, and has rode entire teams of clones to repeated victory. On the other hand, dog clones are still extremely expensive (~$131,404.13$100,0002018) and prices have not yet come down to the ~$13,140.41$10,0002018–$26,280.83$20,0002018 of cattle.
There may be cheaper alternatives to improving SF dog yield: training is probably well-refined and can’t be watered down without risking lives, but that leaves a place for improvement of what is trained, the selection into training—better prediction of SF potential means fewer dogs washing out means less total money spent to produce a successful SF dog. The predictions don’t work well, but the descriptions of screening suggest there’s a lot of room for improvement: the research literature supports the generalization that dog and cat behavioral measurements are not all that predictive. They may be badly designed or testing the wrong things, or there may be inherent noise which can be fixed by doing multiple measurements. (Even something as apparently mechanical as offering catnip to a cat can have different results from occasion to occasion and may have rater-specific effects, perhaps because—“set and setting”—the cat is fearful and distrusts the person offering the catnip that day, with the anxiety shutting down any response or play.) Many described measurements in the literature measure a dog once, on one day, by one person, for example, measuring aggressiveness by taking away food and seeing if the dog snaps at the person, and that’s the whole test. Such a test will be hindered by day-to-day variation (perhaps he is stressed that day), different levels of liking for that particular food, disliking of the person taking the food, sheer randomness in the particular split-second decision of whether the dog decides to express their aggression—likely would be much stabler and predictive if they were done multiple times in multiple ways by multiple people etc. (although such extended testing would increase the cost of testing). Of course, that would take more time and would cost a lot more, and it’s unclear the increase in predictions is worth it.
However, ranking for selection is easier than prediction of all datapoints: only the ordering matters, and only the ordering in a particular region (near the threshold) matters. When considered in a real-world context, such predictive improvements do not need to be all that large (a point long made by psychometricians & industrial psychologists eg. Taylor & Russell 1939/Schmidt et al 1979/Lubinski & Humphreys 1996); counterintuitively, a score or test which correlates, say, r = 0.10 with an outcome, which in many areas of science would be dismissed as a trivial correlation of no interest, can be quite useful in screening & should not be dismissed as ‘small’—and the rarer the outcome, the larger the benefit.2 In the case of dog cloning, our ‘score’ is the extent to which a donor’s performance predicts the performance of its clones, through their shared genes.
Both approaches could wind up being expensive and there’s no a priori answer about which one would be more cost-effective. To a certain extent, they are also mutually exclusive approaches: dog cloning is so expensive that unless it results in high probability of success, it probably won’t be cost-effective at all, and if the probability is sufficiently high, then testing is no longer useful (because you would save money by simply trying to train all clones), so better testing is unlikely to then pay for itself. Testing to gain information is only profitable in a certain intermediate region of probabilities & costs/benefits.
So it’s not absurd to think that dog cloning could work out well for training SF dogs, and I took a closer look.
Benefits
The benefits of dog cloning are not limited purely to replicating an elite SF dog. The potential benefits of dog clones include:
lower total cost: the primary reason for cloning is that since dog clones are more likely to succeed in training given any reasonable heritability, they may reduce washout costs enough to compensate for the expense of cloning.
But the total lifetime cost of a dog goes beyond success or failure in becoming a useful dog. Successful dogs can still learn at different rates, and require more or less intensive intervention by trainers. Dogs can learn multiple roles, so a ‘success’ may only be a partial success, like a dog who is approved for odor detection of bombs or drugs, but can’t be used on patrol or raids. They can have longer or shorter careers, reflecting levels of competence and medical issues (hip dysplasia constantly comes up in war dog discussions as a disabling medical problem, and is highly heritable).
Hence, discussing only success/failure in training and the reduction in average training cost will seriously underestimate the benefits of cloning the best: clones of the best SF dogs will train faster, with less effort/time, excel at more roles (more likely to be acceptable for at least one role), be less likely to have crippling medical issues that kill them or end their careers prematurely, and have longer careers in general.
greater scalability in dogs: there are only a few dog breeders, and they have only a relative handful of bitches at any time
Even if demand spiked in a war and 1,000 more dogs were needed yesterday, they wouldn’t exist—dogs take a certain amount of time to reach sexual maturity, have only so big litters, mating in inbred/narrow pedigrees like German Shepherds/Malinois must be managed carefully to avoid exacerbating existing genetic issues (and eating the seed corn), training takes a while (Ritland notes that the US Navy takes delivery of 2-year-old dog candidates), and so on. In reading about US war dogs, a perennial theme noted by Hammerstrom 2005 is that a war happens (WWII, Vietnam, War on Terror), war dogs become incredibly useful to frontline troops, and dog supply simply cannot keep up.
Use of cloning can break part of the bottleneck by enabling surrogacy in female dogs of other breeds which are not scarce, and by enabling unlimited reproduction of a particular dog. (This doesn’t require cloning, since one could create the necessary embryos with standard IVF, but since the IVF/surrogacy is necessary, why not use cloning as well?)
This option is highly valuable and justifies dog cloning on its own; and because this option is available, militaries can more steeply reduce war dog numbers during peacetime as no ‘reserve’ is necessary.3
greater scalability in facilities: another bottleneck might be not the number of dogs, but the infrastructure for housing/training/testing the dogs.
There might be only so many dog kennels and experienced dog trainers at any point, and increasing the number could take a while. (You probably want the trainers and program management to have SF dog handler experience themselves, but it might take decades for a recruit to become an experienced trainer.) So given the inelastic throughput, here it would be valuable to improve the quality of inputs, which will increase the total yield, simply because it means less dilution or waste of scarce fixed housing/training/testing slots on dogs less likely to succeed.
greater predictability:
Response to Training: yield might be increased simply by the inherent homogeneity of clones allowing improved training by greater experience, rather than any increased genetic merit.
One of the reasons Adolfo Cambiaso gives for investing so heavily in clones of a single polo horse is that he has learned from his long experience with the donor horse how best to train them: each new clone can be given personalized training which he knows it’ll respond best to, because he’s trained many clones before them. If there is some consistent weakness the clones are prone to, he can start addressing it before it even shows up. He also has gained long experience with their injury propensities, preferences, and other behavior, instead of starting from scratch with each new colt. Their similarity avoids the need for learning or wasted pedagogy.
Dogs presumably vary as much as horses do, and training of clones could benefit from this sort of homogeneity. (Since dog trainers will have never encountered clones before, and identical twin dogs are vanishingly rare, there’s no way to know how useful this would be in practice until large numbers of dog clones have been trained by individual trainers.)
Reduced Variance for Experimentation or Analysis: statistical power scales poorly with increasing variance; relatively small increases in noise can require much larger n to overcome. The most efficient experiments are within-subject experiments, which avoid comparisons between individuals, but these are often impossible—one could not test improvements in puppy rearing, for example, or most training program changes. This is true of many things in humans as well; for this reason, experiments with identical twins are highly efficient (in the Lanarkshire milk experiment, a sample of n > 10,000 children could have been replaced with n~300). Identical twins are remarkably powerful even in the absence of randomization for inferring causation (Turkheimer & Harden 2014) and by controlling for all genetics (which in human research, debunks a large fraction of all correlational research in psychology/sociology), make correlational analyses much more likely to deliver useful causal insights. As dog identical twins hardly exist, this has hitherto been entirely unavailable a research design for dog researchers, but clones change that.
Reduced Variance For Process Control: given the choice between a small group of clones and a much larger group of regular dogs, such that they have ostensibly identical average costs & the same number of expected successes, which should a breeder or trainer prefer? The small group of clones, of course.
The large group will, by the law of small numbers, have larger absolute fluctuations due to randomness, especially with a base rate like 1%. It’ll be ‘feast or famine’. Sometimes there will be considerably more, sometimes considerably less in absolute numbers. This will complicate planning greatly, stress facilities/trainers, risk delivering too few (or too many) dogs each year, and so on. Switching to clones with a higher base rate will make the overall process more controllable and predictable, and this is worth something.
use in selective breeding:
The major use of cloning in cattle is for accelerating breeding programs, and not for their immediate marginal increase in meat or milk yield. While dog breeding is not nearly as sophisticated, the benefits of cloning may also be larger for the long-term improvement in the breed than for its immediate benefits in each cloned dog:
clones can improve Estimates Of Genetic Merit by providing the most accurate possible heritability estimates (genetically identical individuals reared in different environments), and correcting individual estimates of traits, which is vital for planning any kind of breeding or selection program
a clone can have a Greater Genetic Potential than the average SF dog if intensive selection is done among SF dogs: if the best SF dog is selected for cloning, it’ll have a higher genetic potential than the default calculation of a truncated normal+regression toward the mean on a random SF dog would imply.
elite clones can be Heavily Used In Breeding Programs in allowing particular individuals to keep contributing genetically long after the original has become infertile or died, or contribute far more (as mentioned before, female dogs are highly limited in reproductive fecundity compared to males, but they could be cloned & born via surrogacy). For example, the first cloned dog, Snuppy, died in 201511ya, but is survived by 3 clones of himself.2, and the record for number of clones appears to be the 49 clones of the world’s tiniest dog, Miracle Milly.4
Value of Information: dog cloning may or may not be worthwhile, but if it is, the total returns from cloning hundreds of dogs per year indefinitely (plus the additional benefits) could be large. It would be valuable to know if it would work.
Since I have not found any SF/military-specific heritabilities reported in the scientific literature (and the SF dog programs generally seem genetically unsophisticated so there may not be any private or classified ones either), the only way to know is to try it out experimentally. The clones’ realized performance would also provide additional valuable information as it would estimate heritability, which would be useful for the regular kinds of breeding & selection as well—because they give an idea of how much one can predict a dog’s performance based on known relatives, and how fast a breeding program can/should proceed.
And since, to be profitable, the success rate of clones need to be >=9% (which is highly likely, see later), this is reasonably easy to estimate: a sample of ~50 clones would give a reasonably precise estimate as to the success rate and enable better decision-making as to whether to keep pursuing cloning (in which case more information will come in and firm up the decision) or drop it as a dead end due to too high costs and/or low heritability. (By the same logic, one could treat choice of donor itself as a multi-armed bandit problem to optimize the selection, since with success rates likely >50%, the necessary sample sizes will be not unreasonable and will be reached as clone use ramps up—like in South Korea, which has at least 42 clone dogs deployed in 2019 and appear to be increasing clone use as they claim great increases in success rates, decreases in costs, and net savings, implying substantial heritability.)
Modeling the SF Selection Problem
South Korea
How could we estimate the benefit of cloning? Given an active dog cloning program like Sooam and sufficient experience, it can be estimated directly.
Choi et al 2014 reports that normally-bred detector dogs have a training success rate of 30% vs 86% for cloned dogs; the 30% appears to be based on the drug detection program, and the 86% is based on their sample of 7 of which 6 passed (ie. 6⁄7 = 0.86)5 Oh et al 2018 notes as a followup
…the Toppy [clones] had the exact same genetic information as the elite drug sniffing dog, whereas the control dogs were the offspring of sniffer dogs. Surprisingly, all seven Toppy were selected with high scores, in contrast with the control group, of which three of the seven trained dogs were selected (Choi et al 201412ya). In the 6 months after the seven Toppy clones were added to airport security, the drug detection rate increased sixfold, at the same time saving the budget for selecting elite dogs. Thus, outstanding abilities can be passed on to the next generation by cloning identical dogs that inherit identical genetic material.
A 2017 Korea Bizwire provides a partial cost-benefit analysis in a press release:
Cloning and deployment of special forces dogs began in 201214ya as part of an initiative by the Rural Development Administration (RDA), in an effort to slash spending on police dog training. Special forces dogs come at a high price. For every dog, an estimated 1.3 billion won ($151,746.02$112,5542017) is spent on training them for multiple purposes such as human rescue, explosive detection and custom service. Despite the price, only 3 out of 10 dogs [30%] make it through the exhaustive training process to serve on police forces. Clone dogs, on the other hand, have a much higher pass rate of 80%, bringing down the training costs to 46 million won ($53,624.91$39,7752017). Compared to regular dogs, they offer savings of 65%.
“Sharing a competent and well-trained dog is no longer impossible, thanks to cloning”, said Im Gi-soon, a chief animal biotechnologist at the National Institute of Animal Science (NIAS).
It’s unclear if this 80% estimate is merely re-reporting Choi et al 201412ya, but if training each costs (3 $44,490.81$33,0002017, so going from 30% to 80% success rate means the clones have a training cost which is 39,775/112,554 = 35% that of the regular dogs or $97,070.86$72,0002017. The costs here clearly exclude cloning, but as Viagen is able to offer consumer dog cloning at $67,410.32$50,0002017 and Sooam has the advantage of experience & much greater scale (in addition to any patriotic discounts), the SK police could be getting a substantially lower price. But if they pay the full $67,410.32$50,0002017 anyway, then they are still reducing the total cost to ((33000+50000) × 10) / 8 = 103,750, saving $11,869.61$8,8042017. And at the $20,223.1$15,0002017 which may be the Viagen marginal cost, they would save $70,853.64$52,5542017.
However, one might doubt these numbers or how applicable they are, and they appear to exclude the substantial cost of cloning, rendering the cost-benefit incomplete.
A 2019 newspaper article states:
According to the Animal and Plant Quarantine Agency, 42 of its 51 [82%] sniffer dogs were cloned from parent animals as of April, indicating such cloned detection dogs are already making important contributions to the country’s quarantine activities. The number of cloned dogs first outpaced their naturally born counterparts in 201412ya, the agency said. Of the active cloned dogs, 39 are currently deployed at Incheon International Airport, the country’s main gateway…While the average cost of raising one detection dog is over 100 million won (US$109,205.76$85,6002019), it is less than half that when utilising cloned puppies, they said.
The lower price here may refer to lower levels of selectivity: “detection dog” vs “training them for multiple purposes”. But the wording implies this refers to total costs, since it states “raising” rather than just “training”, which usually means a total cost from the beginning. So if training each candidate dog costs the implied $32,761.73$25,6802019 and the success rates continue to be 30% vs 80%, and the clones have a per-success cost half that of normal dogs, then the implied amortized cloning cost would appear to be ~$10,920.58$8,5602019 (85,600 × 0.5 = (10 × (25,680+8,560)) / 8).
Cost-Benefit in Selection Problems
How would we approach this problem from first principles?
A SF dog is highly selected among candidate dogs, and it is either an acceptable SF dog or not. Being a SF dog requires a package of traits, ranging from physical health to courage to finely-controlled aggression (attacking if the handler orders, immediately stopping when counter-ordered), which sum up to an overall quality: somewhat poorer health can be made up by better smelling skills, say.
So a natural approach is to treat it as a logistic model, or more specifically, a liability threshold model (“Ch25, Threshold Characters”, Lynch & Walsh 199828ya): if a bunch of random variables all sum up to a certain high score, the dog becomes SF, otherwise, it is a normal dog. These random variables can be split into genetic variables, and everything else, ‘environmental’ variables.
Then the benefit of cloning can be estimated based on how much the genetic variables contribute to a high score, how high the genetic variables of a cloned SF dog might be (remembering that they are highly selected and thus imply regression to a mean), and this provides an estimate for increased probability that the clones will achieve a high score too. This is effectively an extreme case of truncation selection where a single individual is used as the ‘parent’ of the ‘next generation’. (This is not a bivariate maximum, because the clone is different from the selected donor individual, and is a draw from a new distribution distributed around the donor’s genetic potential.)
Once the probability a clone will succeed versus a random candidate dog is calculated, then one can get the cost of screening candidate dogs for a SF dog versus cloning+screening clone dogs for a SF dog.
So we need to know:
how difficult it is for a regular SF dog candidate to succeed, and what the implied threshold for a ‘SF score’ is of a random SF dog, and of an elite SF dog
if possible, how much less difficult it is for a cloned SF dog candidate to succeed, for the implied boost in their average scores
the cost of training a regular SF dog candidate
the cost of cloning an elite SF dog
the heritability of SF success, or failing that, dog traits in general as a prior
The answers seem to be:
<1% of breeder puppies may eventually make it to successful SF deployment; most selection happens in the 2 years before handover from the breeder to the military, and failure rates are substantially lower during the military training. For more conventional military or police use, success rates are much higher, and from puppy to deployment, probably more something like 25%.
Of successful SF dogs, the SF cloning pilots appear to be choosing from dogs in the top 1% or higher of SF dogs.
the post-handover cost of training per SF dog is likely >$63,788.41$50,0002019, with total lifetime cost being higher; conventional military/police dogs are again much less stringently selected/trained and thus cost much less, perhaps as low as $25,515.37$20,0002019.
dog cloning costs have dropped steeply since the first cloned dog in 20056 (in large part thanks to consumer demand for pet cloning), with 2019 list prices at <$63,788.41$50,0002019 and marginal costs possibly as low as $20,412.29$16,0002019 (so cloning at scale could cost only >$20,412.29$16,0002019)
Base Rates
Dog Success Rates
Frost 1990, in a broad review of military working dog training: “However, this ‘European solution’ turned out to be only temporary, as rejection rates continued to remain high, and continue today in the range of 25 to 50% (Andersen, Burke, Craig, Hayter, McCathern, Parks, Thorton).”7
Hammerstrom 200521ya, discussing Vietnam-era war dogs, cites Lemish 199630ya that there was “a high rejection rate of 30 to 50% of the potential canine recruits”.
Sinn et al 2010 finds in their US Air Force sample, 21% of dogs failed both types of training, summarizes the overall failure rate as “In many selection and training programs for police and detection dogs, more than half of the candidate dogs are rejected for behavioral reasons (Wilsson and Sundgren, 199729yab; Slabbert and Odendaal, 199927ya; Maejima et al 2007)”8, and notes that given the costs of a failed candidate, “While the improvements in prediction observed here were small (2–7%), given the costs of purchasing, importing, housing, and training (approximately $29,210.69$18,5002010US per dog), this small percentage improvement results in a substantial potential savings.”
A 2011 article on the 341st estimates that “The suitability rate runs around 50%. In other words, to produce 100 serviceable dogs per year, the program will attempt to train about 200.”
The 201412ya Bloomberg quotes Badertscher as saying “you’re lucky if one or two dogs out of a litter of eight might have the drive and focus to become the kind of dogs who can find bombs, take fire, and work independently on command—let alone jump out of airplanes at night.” A followup article quotes a trainer as estimating “maybe out of a litter of eight only four would be police service dogs or military dogs”.
Ritland 201313ya describes dogs appropriate for Navy Seals as being “a one-in-a-thousand (or more) proposition…I call them 1 percenters…but they are more like one in ten thousand.”9
Stripes, reporting on Sooam, states in 2016:
But breeding and training programs are costly and often inefficient. For example, the school that trains K-9s for the Department of Defense has found that the suitability rate runs around 50%, so the program tries to train about 200 dogs per year to produce 100 that are serviceable.
The aforementioned South Korean newspaper article put regular dogs in the sniffer training program at 30% success rates.
A trainer at the USDA National Detector Dog Training Center in 2019 described screening the general population of dogs for candidates: “We could look at 100 dogs and not come back with any…once they go through initial testing, the percentage of those dogs that make it is maybe 70%.”
Clone Success Rates
One of the first working dogs cloned was a particularly famous Canadian police dog Trakr, whose handler/owner James Symington, won a Sooam contest and received 5 clones of Trakr in 200917ya, which he began training in search-and-rescue under the auspices of his Team Trakr Foundation (TTF). TTF appears to have gone defunct sometime before 2014, with its last nonprofit filing in 201115ya, and I am unable to find any information about how the 5 clones worked out. (I have pinged TTF’s contacts.)
South Korean police in 201115ya reported a 7⁄7 success rate for the clones vs 3⁄10 for normal dogs.
Australia was reported to be working on a 201115ya deal to have up to 10 cloned sniffer dogs by 2013, but as there is no trace of these Australian dogs elsewhere, the deal must have fallen through.
The 201412ya Bloomberg article on Sooam (“For $100,000, You Can Clone Your Dog: These two were made to order in a South Korean lab. They’re only the beginning”) reported that Sooam had a contract for 40 dogs for South Korean clones of which “several are already in service” (presumably the 7 reported before), and also on the birth of 2 clones of a particularly elite SF dog then serving in Afghanistan (name classified), “Ghost” and “Echo”, later joined by a third, “Specter”; the American trainer involved, Brannon, praises the results, reporting in 2016 a 3⁄3 success rate (as opposed to a more typical 4⁄8 estimate given in the article):
Brannon says cloning seems to take the guess work out of normal breeding procedures. “Meaning, you have an excellent male an excellent female, and maybe out of a litter of eight only four would be police service dogs or military dogs,” according to Brannon. Specter is the third clone that the kennel has trained, and the other two are now working with federal SWAT units. “Right now we are 3 for 3 and they’re all successful,” said Brannon.
A New Scientist report in 2016 visiting Sooam mentions 4 German Shepherds from 1 donor for SK police: “two 9-month-old German shepherds, cloned for the national police. Their original was a working dog deemed particularly capable and well-disposed…Further down is another pair of puppies cloned from the same donor; these ones are just 2 months old.”, commenting on how “incredibly eerie” it is to see dogs with the same “mannerisms” and “perky left ear…like looking at a living growth chart.” If formal police training began at 2 years of age, by 2019 all 4 should be known as successes or failures.
Stripes reported in 2016 that 2 of Brannon’s clones finished training & were working for ATF and that Brannon was receiving another clone.10
3 Sooam-cloned Malinois were gifted to Russia in 2016; they reportedly badly failed initial testing in 2017, which was blamed on their thin fur coats being unsuited to the Yakutsk cold. (I don’t know if this should be considered a 0⁄3 example or not, given that there were apparently extenuating circumstances.)
The aforementioned South Korean newspaper article put clone dogs in the sniffer training program at 80% (vs 30%).
The first (and as of August 2019, only?) Chinese cloned police dog, Kunxun, was reportedly successful in training & accepted for duty. Another 6 dog clones began police training in November 2019.
As of late 2019, K9 dog clone success rates are apparently high enough to allow one K9 dog breeder to offer “a better, a five-year warranty instead of a single-year warranty, which is offered by the other kennel”; and an ex-Navy Seal trying to launch a business for providing guard dogs in large volume for schools to guard against mass shootings, Joshua Morton, trains only clones (a team of dog & handler is $159,471.03$125,0002019/year), due to the reliability of cloning & training a particular dog: “Cloning allows me to be consistent. Now, I know that I can tell a client, ‘Hey, I’ll have this dog ready in nine months.’…It’s way more effective, way more efficient.” Olof Olsson of Sooam in January 2021 is quoted as saying “80–90% end up going into service and we’ve been told multiple times that our clones respond better to training.” In 2021, Shaun Spelliscy cloned an unique sniffer dog trained to detect sulfuric metal ores, and thus far both cloned puppies appear to have the same talent as the original.
Reliable dog therapeutics. On a side note, one can wonder about medical sniffer dogs. Individual dogs have been demonstrated to be able to smell everything from C. difficile bacterial infections to breast cancer to Parkinson’s disease (as can at least one human), but as commenters typically point out, the individuality makes it difficult to fit medical sniffer dogs into medical regulatory frameworks—when each dog is an unique individual, how do you screen dogs for sniffer talent, train a standardized sniffer dog, or validate trained sniffers en masse (as we expect of medical drugs or tests)? Cloning could potentially drastically simplify the process of researching medical sniffer dogs, training them, procuring them in adequate quantities, and validating them. Given a clone of a known highly-talented sniffer dog put through a standardized training process, a regulatory standard could treat a trained clone as a kind of generic drug which satisfied bioequivalence, as opposed to if it were an entirely new dog (which are perhaps analogous to biosimilar drugs).
Heritability
The connection between being a clone and success probability is mediated by the accuracy of prediction from a donor to the clone, and to what extent a high donor ‘score’ predicts a high clone score.
A donor & clone are equivalent to a pair of identical twins raised apart (MZAs), and this prediction is simply the heritability of the trait (which is the square, so a r = 0.10 is a h2=0.01). In humans, h2s for everything average ~0.50 or r = 0.70; dogs seem to average lower heritabilities, with much of the genetic variance between dogs being the breed-level differences (which have already been exploited by dog breeders/SF trainers in their focus on Malinois etc.), but even if the heritability is a fifth the size, a h2=0.10/r = 0.31 is useful.
SF-specific dog heritabilities should be calculable using existing pedigree records from breeders or the occasional government programs, but I didn’t find any mentioned in my reading.
Dog heritabilities in general vary widely and are difficult to summarize because of equally widely varying methods, breeds, and analyses. Having been heavily selectively bred, there are large between-breed differences in behavior due to genetics (most recently: “Highly Heritable and Functionally Relevant Breed Differences in Dog Behavior”, MacLean et al 201911; “Absolute brain size predicts dog breed differences in executive function”, Horschler et al 2019); these group-level heritabilities are irrelevant to this analysis as candidate dogs are already drawn from the best-suited breeds, and it is the remaining within-breed individual genetic differences which matters. This narrower heritability is most frequently estimated <0.50 on measured traits, and the most recent meta-analysis,Hradecká 2015 finds global mean heritabilities like 0.15/0.10/0.15/0.09/0.12, which would seem to not bode well for cloning.
However, the dog heritability literature is plagued with serious measurement error issues: the measured variables are unstable, unreliable, do not predict within the same dog over long periods of time, and are generally psychometrically inadequate. Measurement error biases heritability estimates towards zero: if a measurement of ‘temperament’ is not measuring temperament but something like how aggressive a particular trainer is, then regardless of how heritable temperament truly is, the measurement’s heritability will be near-zero; but one would be badly mistaken to then infer that temperament cannot be affected by breeding or that a clone will have a completely different temperament from the donor. In the papers which report relevant aspects of measurement error, the measurements are typically extremely bad, with r = 0.1–0.2 being common (for comparison, a properly administered IQ test will be r > 0.8). If one adjusts a measured heritability estimate like 0.09 for such noisy measurements, the true heritability could be easily be 0.66 or higher. MacLean et al 2019 reports a set of behavioral trait heritabilities within-breed averaging ~0.15 (see also Table 4, Ilska et al 2017), using the C-BARQ inventory, developed with factor analysis and which has reasonable test-retest reliability r~0.5 and loading ~57% on the latent factors, suggesting a true mean heritability >0.24.
Another issue is the interpretation of a low heritability on individual behavioral traits: should SF heritability be thought of as a single trait, perhaps the sum of a large number of more atomic behavioral traits, in which case low heritabilities mean that an elite SF dog still has only a somewhat higher total genetic advantage than a random SF candidate dog? Or should, given the need for long sequences of correct decisions & actions drawing on many traits without a single mistake, we see it as more of a leaky pipeline/log-normal-like trait, in which a small advantage on each atomic behavioral trait (due to stringent selection + low heritabilities) nevertheless multiplies out to a large difference in the final outcomes—and so a clone will outperform much more than one would expect from a low heritability on each atomic trait?12 Perhaps most relevantly, Goddard & Beilharz 1982 examine guide dogs, and estimate the heritability of a ‘success’ trait rather than individual traits or subtests, which is much higher than the behavioral mean heritabilities: 0.44 (higher than 4⁄5 of the behavioral traits they estimate). A “success” trait here is an “index score”, by weighting correlated variables according to their importance, tend to be optimal predictors with much greater heritability, and to outperform individual variables (Lynch & Walsh 2018: ch37 “Theory of Index Selection”/ch38 “Applications of Index Selection”).
Sooam has published behavioral research on cloned dogs: Kim et al 2018/Lee et al 2018/Oh et al 2018 reviews. None of the Sooam papers take a behavioral genetics approach or attempt to estimate heritability/genetic correlations/liability threshold models despite those being necessary for a correct answer, so they have to be read closely.
Choi et al 2014 has already been reviewed. Kim et al 2018 states that 4 clones of a cancer-sniffing dog were made but “ownership problems” prevented more than one from being evaluated, which Kim et al 2018 states had similar capabilities as the donor (cited to Kim et al 2015 which I am unable to download or read). Oh et al 2016 compared 2 clone puppies, finding them similar on the Puppy Aptitude Test. Shin et al 2016 tested learning/memory/exploration in 6 clones versus 4 controls, showing generally lower variance; no variance statistics are reported (just p-values), but counting dots on the plots, the implied variance all look >50% to me. Lee et al 2016 mated a cloned detector dog with a regular female dog and tested the 10 offspring; the offspring achieved above average scores with a pass rate of 60% (which is roughly intermediate regular dogs and cloned dogs, suggesting high heritability given a non-detector mother). Choi et al 2017/Choi 201813 found greater consistency of behavioral traits in clone than control puppies but did not estimate direct correlations/heritabilities, instead using calculating F-tests comparing the two groups’ variances; since these are unrelated control dogs and a single group of clone, the reduction in variance should be equivalent to heritability and can be read off from the F subscripts, in which case the various heritabilities are 0.20/0.35/0.40/0.23 etc.
Since clones have already been deployed in practice, we can try to work backwards from observed success rates of clones vs normal dogs. The anecdotal instances imply high success rates, nearing 100%, vs standard success rates of <50%, but a tiny total sample size and unclear definitions of success. More specifically, the South Korean sniffer program reportedly has 30% vs 80% on a common outcome, and the sample size is unclear but potentially into the hundreds.14
Using the liability threshold model, one could work back from a threshold and difference in success rates to estimate an implied heritability. In this case, the cutpoints for 30% and 80% are −0.52SD and +0.84SD, implying the clones are +1.36SD above the normals, ignoring any selection before enrollment. That is the mean they regressed back to, based on the unknown heritability (how much back to regress) and a certain threshold (how high the donor/original started off).
The lower the threshold, the greater heritability must be to avoid throwing away ability and still matching the observed success rate; the higher the threshold, the lower heritability can be while still providing enough ability-enrichment in the clones to have that higher success rate. In this case, we can assume a threshold like <1%, given that only elites are being cloned and this is consistent with everything else, in which case then the necessary heritability turns out to be… ~50%, which is plausible:
qnorm(0.80) - qnorm(0.30)
# [1] 1.36602175
0.513 * truncNormMean(qnorm(1-0.01))
# [1] 1.3672549
So based on the existing dog literature and extrapolating from the current observed 80–100% dog success rates, a heritability of ~50% seems most plausible to me.
Costs
Training
But that may be worthwhile depending on how expensive it is to train enough dogs to get a successful dog, and how expensive cloning is.
For comparison, similar highly-trained civilian dogs, trained in Schutzhund (sometimes by trainers who used to train for Special Forces), can sell for $62,102.5$40,0002011–$93,153.75$60,0002011 with Ritland selling his dogs at $67,410.32$50,0002017–$134,820.64$100,0002017, and the best award-winning “executive protection dogs” selling for up to $357,089.36$230,0002011. Bloomberg notes “Canines with finely trained noses now fetch $33,705.16$25,0002017 and up on the open market, where border patrol units, the State Department, and private security firms go for canine talent.”
Hammerstrom 2005 quotes two cost estimates of a US military contractor BSI 1969–197056ya at $46,533.34$10,0001974 (Lemish 199630ya/199927ya, War Dogs: A History of Loyalty and Heroism) and $69,800.02$15,0001974 (cited to “Perry Money, a former Marines Corps handler of a BSI dog”), and mentions a program to breed dogs for better health & “superior ambush detection” (which failed for unknown reasons); he also quotes US Air Force LTC Bannister, commander of the 341st Training Squadron, as estimating the 120-day “DoD MWD Course” at $84,890.1$50,0002005 “per trained dog” (unclear if this refers to average over all dogs, or per successful ‘trained’ dog)15. Sinn et al 2010 quotes US Air Force training of patrol & detection dogs at ~$29,210.69$18,5002010, with a 21% total failure rate implying a 1.2x higher cost per success of ~$36,974.41$23,4172010. A 201115ya NYT article on Marines notes it is “an expensively trained canine (the cost to the American military can be as high as $62,102.5$40,0002011 per dog)”. Ritland & Brozek 201313ya quotes a US Navy SEAL dog’s individual cost at >$75,054.87$50,0002013.16 South Korean police quote a drug sniffer dog at $62,102.5$40,0002011 for training in 201115ya. Bloomberg 2017 reports “The U.S. military spends up to $381,542.41$283,0002017 to train a working war dog…Once it has a promising pup, the Pentagon spends an additional $56,624.67$42,0002017 to train a K9 unit…When all is said and done, a fully trained military dog costs about as much as a small missile.”17 A 2019 Chinese source on the first domestically-cloned police dog (cloned from a donor police dog who is “one in a thousand”) cites a standard police dog training cost of $95,682.62$75,0002019 over 5 years; the clone was reportedly successful in training. A 2019 Wired notes “Highly trained bomb- and disease-sniffing dogs are in short supply and expensive, as much as $31,894.21$25,0002019 per pooch.”
These estimates vary considerably, and seem to reflect heterogeneity in what cost is being calculated, how selective a role or facility is due to difficulty of role (police dogs cost less than single-role military dogs who cost less than multi-role dogs who cost less than Special Forces dogs). But it’s hard to see what is driving some of these differences, like the 6x difference between Ritland/Bannister and Bloomberg’s estimate, as a Navy SEAL dog is presumably a “working war dog”. It seems to me that the Ritland/Bannister figure is referring to the cost to train a single dog who happened to be successful (plausible since Bannister is providing a 200521ya estimate from the dog training facilities he oversees), while the latter refers to the total cost to get one successful dog out of an unspecified number of candidates; if they are referring to the same dogs, then the implied success rate is 1⁄6. Ritland guesstimates that the failure rate among his SF dogs, after they have passed all of the thresholds which lead to formal acquisition by the US Navy (which Ritland emphasizes represents most of the selection done on the dogs), is “more like 3 or 4 in 10 instead of 7.5 out of 10”, which, combined with some additional failures or expenses elsewhere in the process, seems reasonably consistent: if each dog costs >$75,054.87$50,0002013, then even at face-value that failure estimate implies substantially higher price-tags. Alternately, the Bloomberg estimate might be a ‘total lifetime cost’ estimate of some sort, including all of the maintenance and equipment and costs during deployment and retirement, while Ritland/Bannister is referring only to the upfront training cost.
It is worth noting, given how much selection takes place before sale to SF trainers, that these costs embed the cost of failure beforehand: breeders are not charities, so however much it costs on net to raise, train, and test the dogs which don’t get bought for training, the sale price of a candidate SF dog must cover the washouts as well (after recouping whatever is possible by washouts’ alternate uses, perhaps in less selective roles), or else the breeder would go out of business.
Cloning
Dog cloning, on the other hand, cost $143,583.84$100,0002015 list price in 201511ya from Sooam, down from the original $233,296.9$150,0002008 in 200818ya, when Bernann McKinney received 5 cloned pit bulls from Sooam.18 Viagen in 2018 reportedly offers a $65,702.07$50,0002018 plan; the profiled pet owner, Amy Vangemert, received 3 cloned puppies (one of which was adopted out) and incidentally intends to do it again as necessary. (Viagen’s price remained the same in 2019.) The Chinese firm Sinogene, which cloned a police dog in 2019, reportedly charges $67,615.72$53,0002019–$71,443.02$56,0002019 for a dog clone, and claims to have done >40 total as of September 2019. A November 2019 anecdote involving a billionaire’s cloned dog stopping a drone mentions “Mini Vader, the $183,710.63$144,0002019 (£111,563) pup that Alki David sourced from Dr Olof Olsson’s Korean-based cloning lab SwissX, earned his jaw-dropping price tag with a mid-air rescue that unfortunately left his owner with a nastily-gashed hand.” Sooam apparently offers a guarantee, and Viagen will refund if not successful, so that price should be firm. (Why Sooam is able to charge twice as much as Viagen, or why SwissX—better known for marijuana-related activities—costs 2–3× as much as anyone else, I do not know.) By 2022, Sinogene was offering dog cloning as low as $25,000.
For comparison, the other kind of commercially-offered pet cloning is for cats. The first commercial cat clone, Little Nicky reportedly cost $88,115.92$50,0002004 in 200422ya; more recently, cat clones from Viagen cost $48,461.28$35,0002016 in 2016 and $31,894.21$25,0002019 in 2019 (although the article notes that “Cloning a dog costs $63,788.41$50,0002019 while a cat is now $44,651.89$35,0002019—the company recently increased the fee by $12,757.68$10,0002019 to cover rising costs.”). I have also been told privately by someone who cloned their cat with Viagen in 2018 that it cost them ~$19,710.62$15,0002018. Overseas, the first Chinese cat clone from Sinogene Biotechnology Company in July 2019 as the start of a commercial service quotes Sinogene as saying it “is expected to cost 250,000 yuan ($45,162.2$35,4002019) each. Zhao told the Global Times that several cat owners had already booked the service, hinting that the future market could be huge. The company also offers a dog cloning service, costing 380,000 yuan [$69,401.79$54,4002019].” After scaling to 100 cats, their 2022 cat price had dropped to $17,500.
The real price per dog may be lower. Their practice seems to be to engage in overkill by implanting multiple clone embryos to ensure the minimum specified number of healthy clones, and offer all resulting healthy live-births to the customer—for example, Vangemert is not mentioned as being charged $150k instead of $50k for the 3 puppies, as would be the case if Viagen charged $50k for each success and she requested 2 and got 3. So the per-clone cost appears to have become surprisingly reasonable: $50k–$100k for 1 dog, and potentially <$16k (if a purchase results in 3 puppies as in Vangemert’s case), suggesting that the price has a large fixed cost to it and the marginal costs might be quite small, which is not helpful in the pet-replacement scenario but would be important to large-scale cloning of specific animals like elite drug sniffers. For comparison, cattle and horse cloning have become industrialized at ~$10–15k; dog cloning is apparently more difficult (harder to control estrous, Viagen notes), so that may be a lower bound for the foreseeable future.
Liability Threshold Model
This requires us to estimate two things: the threshold and the heritability on the liability scale.
For common police dogs and other working dogs, training appears to be not that hard, and estimates of 30–50% are seen. This gives a threshold of 50%, or in standard deviations, 0SD.
A SF dog is much more selective, and the only specific estimate given is <1% by Mike Ritland, which in standard deviations, means each dog would be >=2.33SD, and the actual mean created by this selection effect is +2.66SD. (If this is confusing imagine a threshold like 50%: is the mean of everyone over 50% equal to 50%? No, it has to be higher, and the mean of everyone >=0SD/>=50% is actually more like 0.8SD/75%—not 0SD/50%!—and we need to use the truncated normal distribution to get it right.)
The clone of the SF dog shares only genetics with it, it doesn’t benefit from the unique luck and environment that the original did which helped it achieve it success, so it will regress to a mean. If genetics determined 100% of the outcome, then the clones would always be +2.66SD just like the donor, and hence make the 1%/+2.33SD cutoff 100% of the time, as they have the same genetic potential and zero environmental input (although that is extremely unlikely a scenario, due to measurement error in the testing if nothing else). While if genetics contributed 0% to the outcome and did not matter, then the clones will make the 1% cutoff just as often as if they were a random dog sampled from their breeders ie. 1%. And in between, in between.
Under a more plausible case like genetics determining 50% of the variability (a common level of heritability for better-studied human traits), then that is equivalent to a perfect genetic predictor correlating r = 0.7; the r, remember, is equivalent to ‘for each 1 SD increase in the independent variable, expect +r SDs in the dependent variable’, so since the clone donor is +2.66SD, the clones will only be 2.66 × 0.7 = 1.86 SD above the mean. If the clones are distributed around a mean of +1.86SD thanks to their genes, what’s the probability they will then reach up to a total of +2.33SD (the threshold) with help from the environment & luck? Half the variance is used up, and the environment has to contribute another 2.33 − 1.86 = +0.47SD, despite causing differences of only 0.7SD on average. In that case, the clones will have ~26% chance of being successful—which is a remarkable 26x greater than a random dog, but also far from guaranteed.
But one can do better, since it is not necessary to select a random SF dog (with their implied average of +2.66SD) but one can select the best SF dog and clone this elite specimen instead. Multi-stage selection is always more efficient than single-stage selection, particularly when we are interested in extremes/tails, due to the ‘thin tails’ of the normal distribution. At any time there are thousands of SF dogs worldwide, and more in retirement (and perhaps more if tissue samples have been preserved from earlier generations), so the gain from an additional selection step is potentially large (especially when we consider tail effects), and since only 1 dog is necessary for cloning, why settle for anything less than the best? If one can select at least the best SF dog out of 100019, then the new ‘threshold’ is +4.26SD and the expectation for our elite dog is +4.47SD, and likewise, the clones at 50% heritability would be +3.16SD, which is considerably above the original SF threshold of 2.33SD, and now fully 88% of the clones would be expected to succeed at SF training. (An implication here is that with enough screening, and perhaps tracking off clone success rates to refine estimates of genetic potential, success rates approaching 100% are entirely possible—one simply needs a donor so far off the charts genetically that the remaining 30% variance rarely pushes clones under the fixed threshold; these failures corresponding to extreme situations like rare crippling diseases or infections, abuse, accidents, etc.)
Source code defining the truncated normal distribution, the cloning process, and a Monte Carlo implementation20:
## exact mean for the truncated normal distribution:
truncNormMean <- function(a, mu=0, sigma=1, b=Inf) {
        phi <- dnorm
        erf <- function(x) 2 * pnorm(x * sqrt(2)) - 1
        Phi <- function(x) { 0.5 * (1 + erf(x/sqrt(2))) }
        Z <- function(beta, alpha) { Phi(beta) - Phi(alpha) }

        alpha = (a-mu)/sigma; beta = (b-mu)/sigma

        return( (phi(alpha) - phi(beta)) / Z(beta, alpha) ) }
## If we select the top percentile, the cutoff is +2.32SD, but the mean is higher, +2.66SD:
qnorm(0.99)
# [1] 2.32634787
truncNormMean(qnorm(0.99))
# [1] 2.66521422
truncNormMean(qnorm(1-0.01^2))
# [1] 3.95847967

cloningBoost <- function(successP=0.01, preThreshold=0.01, heritability=0.5,
    verbose=FALSE) {
  threshold <- qnorm(1-preThreshold)
  successThreshold <- qnorm(1-successP)

  originalMean <- truncNormMean(threshold)
  cloneMean <- 0 + (sqrt(heritability) * originalMean) ## regress to mean
  regression <- originalMean - cloneMean

  cloneP <- pnorm(cloneMean - successThreshold, sd=sqrt(1-heritability))

  if (verbose) { print(round(digits=3, c(threshold, successThreshold, originalMean,
                                         cloneMean, regression, cloneP))) }
  return(cloneP) }
## Alternative Monte Carlo implementation to check:
cloningBoostMC <- function(successP=0.01, preThreshold=0.01, heritability=0.5,
    verbose=FALSE, iters1=10000000, iters2=1000) {
  threshold <- qnorm(1-preThreshold)
  successThreshold <- qnorm(1-successP)

  r     <- sqrt(  heritability)
  r_env <- sqrt(1-heritability)

  ## NOTE: this is a brute-force approach chosen for simplicity. If runtime is
  ## a concern, one can sample from the extremes directly using the beta-transform trick:
  ## https://gwern.net/order-statistic#sampling-gompertz-distribution-extremes
  population  <- rnorm(iters1, mean=0, sd=1)
  eliteDonors <- population[population>=threshold]

  clones <- as.vector(sapply(eliteDonors, function(d) {
    rnorm(iters2, ## sample _n_ clones per donor
        ## regress back to mean for true genetic mean:
        mean=d*r,
        ## left-over non-genetic variance affecting clones:
        sd=r_env) }))

  successes <- clones>=successThreshold
  cloneP    <- mean(successes)

  if (verbose) { library(skimr)
    print(skim(population)); print(skim(eliteDonors)); print(skim(successes)) }

  return(cloneP)
}

## Varying heritabilities, 0-1:
cloningBoost(successP=0.01, heritability=1.0, verbose=TRUE)
# [1] 2.326 2.326 2.665 2.665 0.000 1.000
# [1] 1
cloningBoost(successP=0.01, heritability=0.8, verbose=TRUE)
# [1] 2.326 2.326 2.665 2.384 0.281 0.551
# [1] 0.551145688
cloningBoost(successP=0.01, heritability=0.5, verbose=TRUE)
# [1] 2.326 2.326 2.665 1.885 0.781 0.266
# [1] 0.266071352
cloningBoost(successP=0.01, heritability=0.2, verbose=TRUE)
# [1] 2.326 2.326 2.665 1.192 1.473 0.102
# [1] 0.102340263
cloningBoost(successP=0.01, heritability=0.0, verbose=TRUE)
# [1] 2.326 2.326 2.665 0.000 2.665 0.010
# [1] 0.01

## Enriched selection by selecting elites rather than random:
cloningBoost(successP=0.01, preThreshold=0.01 * (1/1000), heritability=0.5, verbose=TRUE)
# [1] 4.265 2.326 4.479 3.167 1.312 0.883
# [1] 0.882736927

## Probability of surpassing the original: while it decreases with increasing threshold…
## (see also https://gwern.net/order-statistic#probability-of-bivariate-maximum )
round(digits=3,
    unlist(Map(function(threshold) {
        cloningBoost(successP=pnorm(threshold), preThreshold=pnorm(threshold), heritability=0.5) },
        seq(0,-8, by=-0.5))))
# [1] 0.788 0.668 0.544 0.428 0.324 0.238 0.169 0.115 0.076 0.048 0.030 0.018
#     0.010 0.005 0.003 0.001 0.001
#
## …it is still *far* above base-rates:
round(digits=0,
    unlist(Map(function(threshold) {
        cloningBoost(successP=pnorm(threshold), preThreshold=pnorm(threshold), heritability=0.5) / pnorm(threshold) },
        seq(0,-8, by=-0.5))))
#  [1] 2             2             3             6            14            38
#      125           496          2405         14273        103765
# [12] 925193      10123773     136019115    2244775378   45505318504 1148533117232
For insight, we can look at how final success probability increases with different heritabilities/rs, in the single-step selection scenario (corresponding to a random selection of SF dogs for cloning) and for the double-step selection (selecting a top 1% SF dog for cloning):
## Plotting the increase in subsequent probability given various correlations:
df1 <- data.frame(PriorP=numeric(), R=numeric(), Success.Rate=numeric())
for (p in c(0.01, seq(0.05, 0.95, by=0.05), 0.99)) {
 for (r in seq(0,1, by=0.01)) {
   df1 <- rbind(df1, data.frame(PriorP=p, R=r,
                    Success.Rate=cloningBoost(successP=p, heritability=r^2)))
 }
}

library(ggplot2); library(gridExtra)
p1 <- qplot(R, Success.Rate, color=as.ordered(PriorP), data=df1) +
    geom_line() + theme(legend.title=element_blank())
p2 <- qplot(R, log(Success.Rate), color=as.ordered(PriorP), data=df1) +
    geom_line() + theme(legend.title=element_blank())
grid.arrange(p1, p2, ncol=1)

## Double-step selection:
df2 <- data.frame(PriorP=numeric(), R=numeric(), Success.Rate=numeric())
for (p in c(0.01, seq(0.05, 0.95, by=0.05), 0.99)) {
 for (r in seq(0.01,1, by=0.01)) {
   df2 <- rbind(df2, data.frame(PriorP=p, preThreshold=p * 0.01, R=r,
                    Success.Rate=cloningBoost(successP=p, preThreshold=p * 0.01, heritability=r^2)))
 }
}

library(ggplot2); library(gridExtra)
p1 <- qplot(R, Success.Rate, color=as.ordered(PriorP), data=df2) +
    geom_line() + theme(legend.title=element_blank())
p2 <- qplot(R, log(Success.Rate), color=as.ordered(PriorP), data=df2) +
    geom_line() + theme(legend.title=element_blank())
grid.arrange(p1, p2, ncol=1)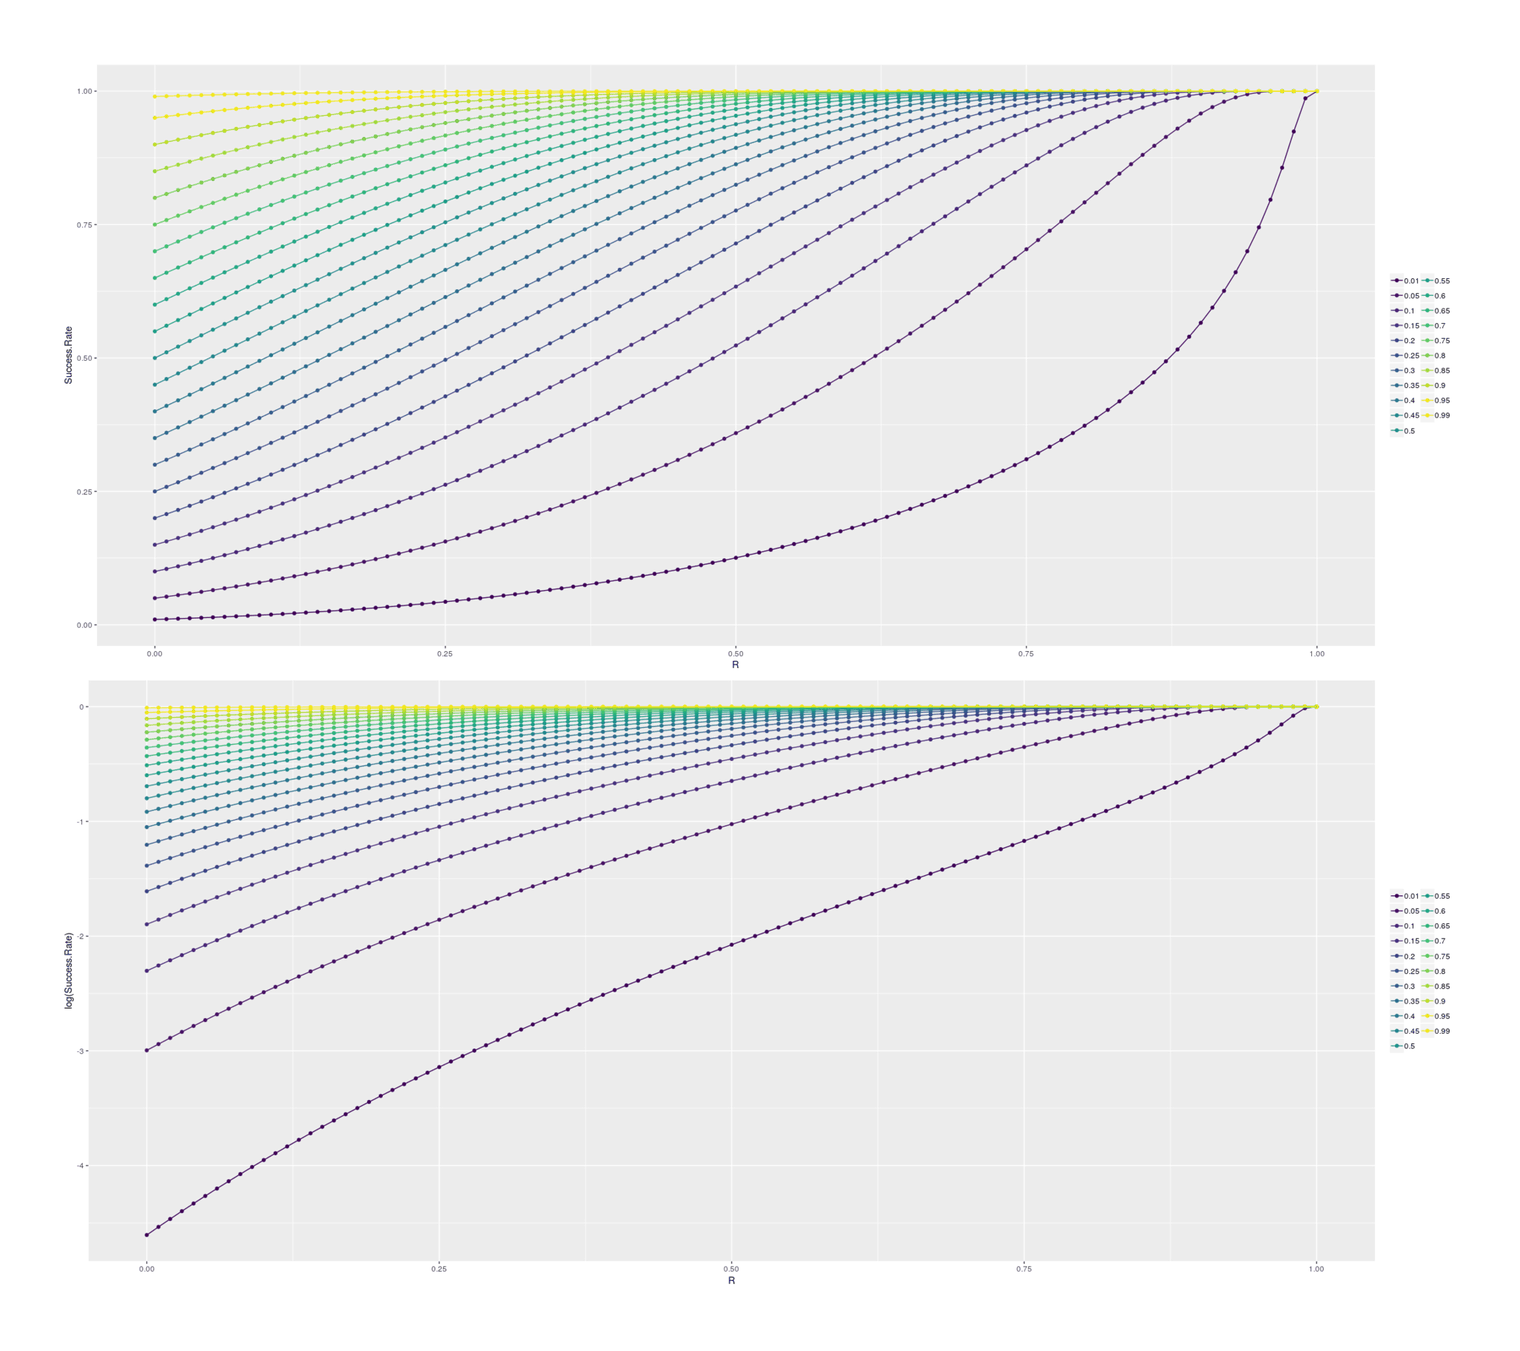
How the probability of post-selection success increases given a prior base rate and a predictor of r power for single-step selection; absolute probabilities, and log-transformed.

Likewise, but with an additional selection step prior to cloning to further select the best one.
Cost-Benefit
Does cloning minimize loss? My cost-benefit below takes the cost per final dog without cloning, computes the implied per-dog-candidate cost, and then computes the increased success rate for a given threshold+heritability, and sees if the expected cloning+training cost is less than the original total cost.
dogCloningCB <- function(successP, heritability, totalTrainingCost, marginalCloningCost, verbose=FALSE) {
    normalLoss           <- totalTrainingCost
    marginalTrainingCost <-  totalTrainingCost / (1/successP)

    cloningP    <- cloningBoost(successP=successP, heritability=heritability)
    cloningLoss <- ((1/cloningP) * (marginalTrainingCost + marginalCloningCost))

    if(verbose) {return(list(Boost=cloningP, Cost.normal=normalLoss, Cost.marginal=marginalTrainingCost, Cost.clone=cloningLoss,
                  Profitable=normalLoss>cloningLoss, Profit=normalLoss-cloningLoss)) }
    return(normalLoss-cloningLoss) }

## Example: 30% success rate, 50% heritability, $85k per-dog training cost, $15k per-clone cost
dogCloningCB(0.30, 0.5, 85600, 15000, verbose=TRUE)
# $Boost
# [1] 0.972797623
#
# $Cost.normal
# [1] 85600
#
# $Cost.marginal
# [1] 25680
#
# $Cost.clone
# [1] 41817.5364
#
# $Profitable
# [1] TRUE
#
# $Profit
# [1] 43782.4636
Scenarios
As the key heritability trait is almost completely unknown and heritabilities of dog behavioral traits are all over the map and seem to suffer from severe measurement error issues, we might as well consider a wide range of scenarios to get an idea of what it would take. For success/threshold, we continue with 1%; for heritability, we’ll consider the most plausible range, 0–90%; for training cost, we’ll do the full $50k–$283k range since while it’s unclear what these numbers mean, treating them as a total per-dog cost is being conservative and makes it harder for cloning to be profitable, and for cloning costs we’ll consider the Vangemert case up to Viagen’s list price of $50k (since there doesn’t seem to be any good reason to pay twice as much to Sooam).
scenarios <- expand.grid(SuccessP=0.01, Heritability=seq(0, 0.9, by=0.10), trainingCost=seq(50000, 283000, by=10000), cloningCost=seq(15000, 50000, by=10000))
scenarios$Profit <- round(unlist(Map(dogCloningCB, scenarios[,1], scenarios[,2], scenarios[,3], scenarios[,4])))

## Plot relationships among profitable scenarios:
scenariosProfitable <- scenarios[scenarios$Profit>0,]
library(ggplot2); library(gridExtra)
p1 <- qplot(cloningCost,  Profit, color=Heritability, data=scenariosProfitable) + geom_hline(yintercept=0, color="red")
p2 <- qplot(trainingCost, Profit, color=Heritability, data=scenariosProfitable) + geom_hline(yintercept=0, color="red")
grid.arrange(p1, p2, ncol=1)

## All profitable scenarios:
scenariosProfitable
# ...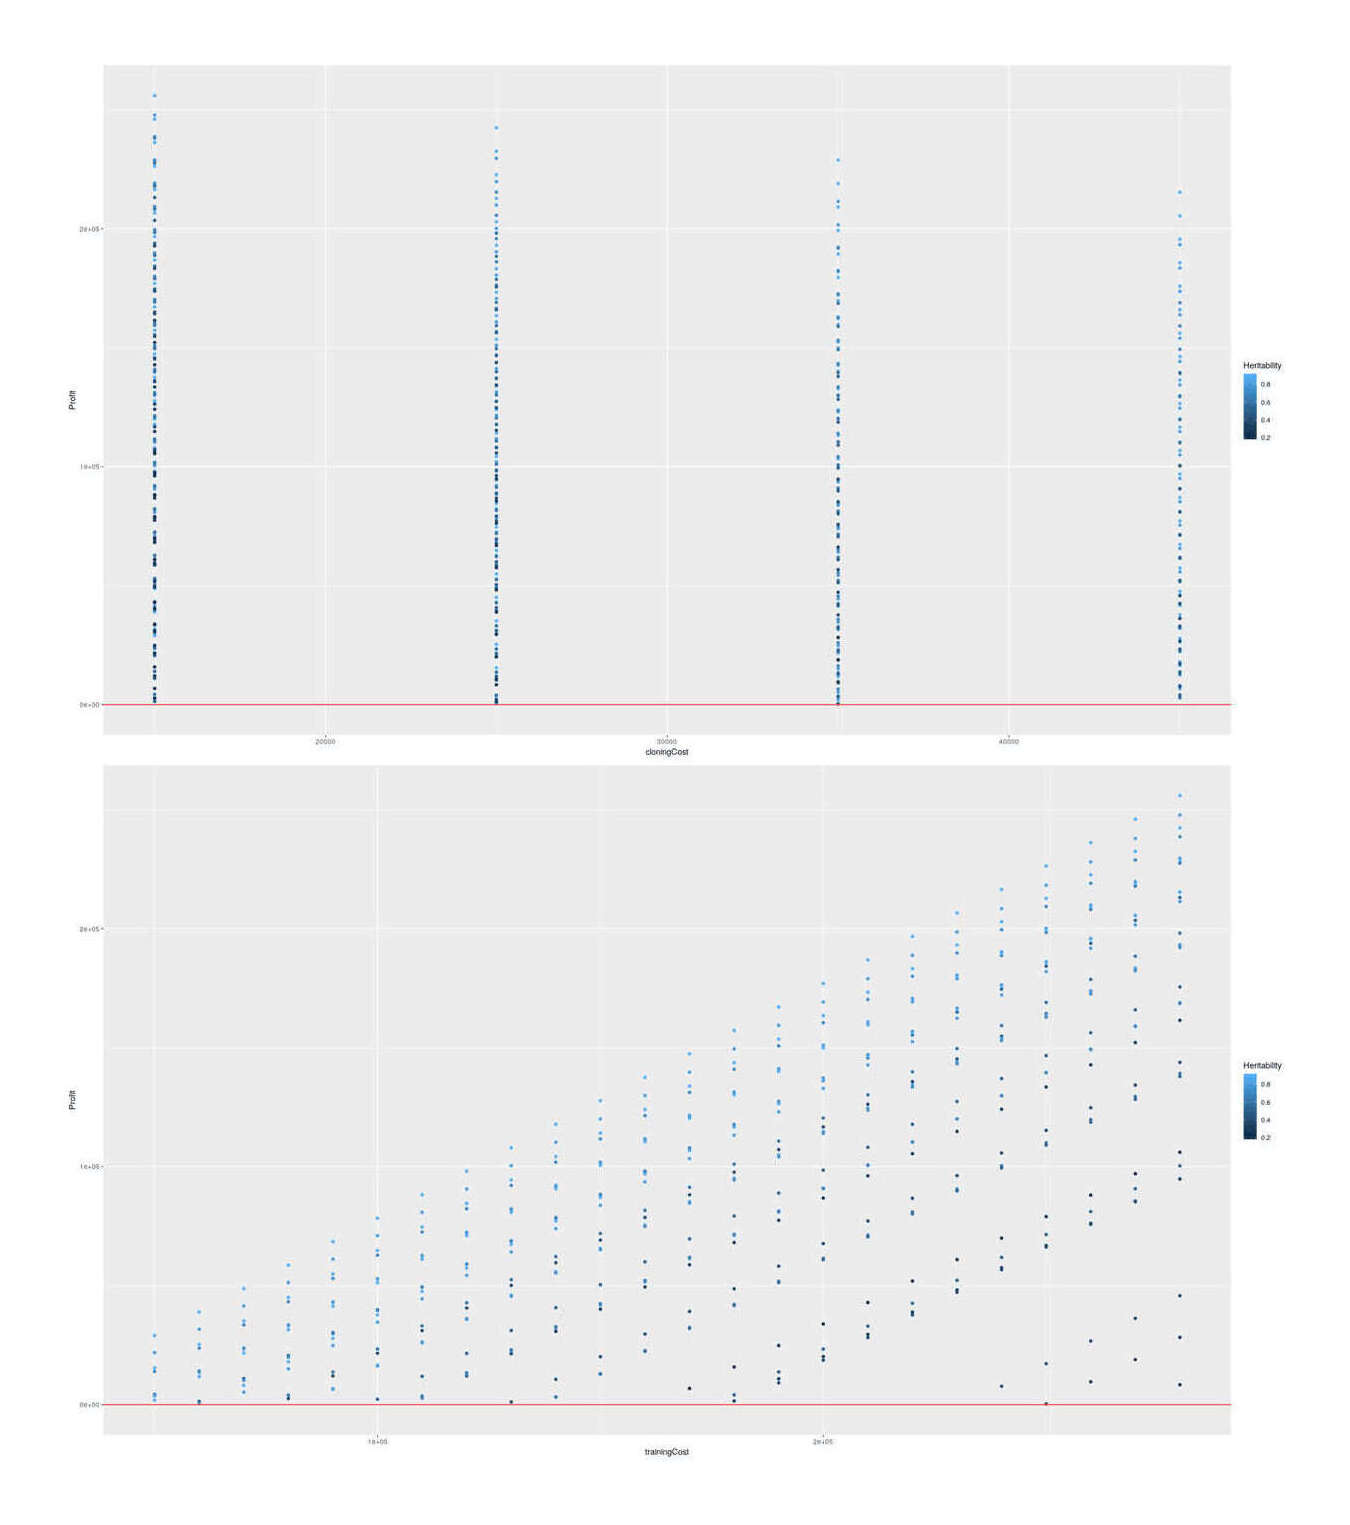
The SF dog cloning scenarios showing profit vs possible cloning & training costs, colored by heritabilities.
Success Probability |
Heritability |
Training cost |
Cloning Cost |
Profit |
|---|---|---|---|---|
0.01 |
0.6 |
50000 |
15000 |
4333 |
0.01 |
0.7 |
50000 |
15000 |
13962 |
0.01 |
0.8 |
50000 |
15000 |
21877 |
0.01 |
0.9 |
50000 |
15000 |
29015 |
0.01 |
0.5 |
60000 |
15000 |
1369 |
0.01 |
0.6 |
60000 |
15000 |
14038 |
0.01 |
0.7 |
60000 |
15000 |
23729 |
0.01 |
0.8 |
60000 |
15000 |
31695 |
0.01 |
0.9 |
60000 |
15000 |
38879 |
0.01 |
0.5 |
70000 |
15000 |
10993 |
0.01 |
0.6 |
70000 |
15000 |
23743 |
0.01 |
0.7 |
70000 |
15000 |
33497 |
0.01 |
0.8 |
70000 |
15000 |
41514 |
0.01 |
0.9 |
70000 |
15000 |
48744 |
0.01 |
0.4 |
80000 |
15000 |
2576 |
0.01 |
0.5 |
80000 |
15000 |
20617 |
0.01 |
0.6 |
80000 |
15000 |
33449 |
0.01 |
0.7 |
80000 |
15000 |
43264 |
0.01 |
0.8 |
80000 |
15000 |
51332 |
0.01 |
0.9 |
80000 |
15000 |
58609 |
0.01 |
0.4 |
90000 |
15000 |
12086 |
0.01 |
0.5 |
90000 |
15000 |
30242 |
0.01 |
0.6 |
90000 |
15000 |
43154 |
0.01 |
0.7 |
90000 |
15000 |
53032 |
0.01 |
0.8 |
90000 |
15000 |
61151 |
0.01 |
0.9 |
90000 |
15000 |
68473 |
0.01 |
0.4 |
100000 |
15000 |
21596 |
0.01 |
0.5 |
100000 |
15000 |
39866 |
0.01 |
0.6 |
100000 |
15000 |
52859 |
0.01 |
0.7 |
100000 |
15000 |
62799 |
0.01 |
0.8 |
100000 |
15000 |
70970 |
0.01 |
0.9 |
100000 |
15000 |
78338 |
0.01 |
0.3 |
110000 |
15000 |
2785 |
0.01 |
0.4 |
110000 |
15000 |
31106 |
0.01 |
0.5 |
110000 |
15000 |
49490 |
0.01 |
0.6 |
110000 |
15000 |
62565 |
0.01 |
0.7 |
110000 |
15000 |
72567 |
0.01 |
0.8 |
110000 |
15000 |
80788 |
0.01 |
0.9 |
110000 |
15000 |
88202 |
0.01 |
0.3 |
120000 |
15000 |
12119 |
0.01 |
0.4 |
120000 |
15000 |
40616 |
0.01 |
0.5 |
120000 |
15000 |
59114 |
0.01 |
0.6 |
120000 |
15000 |
72270 |
0.01 |
0.7 |
120000 |
15000 |
82334 |
0.01 |
0.8 |
120000 |
15000 |
90607 |
0.01 |
0.9 |
120000 |
15000 |
98067 |
0.01 |
0.3 |
130000 |
15000 |
21453 |
0.01 |
0.4 |
130000 |
15000 |
50126 |
0.01 |
0.5 |
130000 |
15000 |
68738 |
0.01 |
0.6 |
130000 |
15000 |
81976 |
0.01 |
0.7 |
130000 |
15000 |
92102 |
0.01 |
0.8 |
130000 |
15000 |
100425 |
0.01 |
0.9 |
130000 |
15000 |
107932 |
0.01 |
0.3 |
140000 |
15000 |
30787 |
0.01 |
0.4 |
140000 |
15000 |
59636 |
0.01 |
0.5 |
140000 |
15000 |
78362 |
0.01 |
0.6 |
140000 |
15000 |
91681 |
0.01 |
0.7 |
140000 |
15000 |
101869 |
0.01 |
0.8 |
140000 |
15000 |
110244 |
0.01 |
0.9 |
140000 |
15000 |
117796 |
0.01 |
0.3 |
150000 |
15000 |
40121 |
0.01 |
0.4 |
150000 |
15000 |
69146 |
0.01 |
0.5 |
150000 |
15000 |
87987 |
0.01 |
0.6 |
150000 |
15000 |
101386 |
0.01 |
0.7 |
150000 |
15000 |
111637 |
0.01 |
0.8 |
150000 |
15000 |
120062 |
0.01 |
0.9 |
150000 |
15000 |
127661 |
0.01 |
0.3 |
160000 |
15000 |
49455 |
0.01 |
0.4 |
160000 |
15000 |
78656 |
0.01 |
0.5 |
160000 |
15000 |
97611 |
0.01 |
0.6 |
160000 |
15000 |
111092 |
0.01 |
0.7 |
160000 |
15000 |
121404 |
0.01 |
0.8 |
160000 |
15000 |
129881 |
0.01 |
0.9 |
160000 |
15000 |
137526 |
0.01 |
0.2 |
170000 |
15000 |
6819 |
0.01 |
0.3 |
170000 |
15000 |
58789 |
0.01 |
0.4 |
170000 |
15000 |
88166 |
0.01 |
0.5 |
170000 |
15000 |
107235 |
0.01 |
0.6 |
170000 |
15000 |
120797 |
0.01 |
0.7 |
170000 |
15000 |
131171 |
0.01 |
0.8 |
170000 |
15000 |
139699 |
0.01 |
0.9 |
170000 |
15000 |
147390 |
0.01 |
0.2 |
180000 |
15000 |
15842 |
0.01 |
0.3 |
180000 |
15000 |
68123 |
0.01 |
0.4 |
180000 |
15000 |
97676 |
0.01 |
0.5 |
180000 |
15000 |
116859 |
0.01 |
0.6 |
180000 |
15000 |
130502 |
0.01 |
0.7 |
180000 |
15000 |
140939 |
0.01 |
0.8 |
180000 |
15000 |
149518 |
0.01 |
0.9 |
180000 |
15000 |
157255 |
0.01 |
0.2 |
190000 |
15000 |
24865 |
0.01 |
0.3 |
190000 |
15000 |
77457 |
0.01 |
0.4 |
190000 |
15000 |
107186 |
0.01 |
0.5 |
190000 |
15000 |
126483 |
0.01 |
0.6 |
190000 |
15000 |
140208 |
0.01 |
0.7 |
190000 |
15000 |
150706 |
0.01 |
0.8 |
190000 |
15000 |
159337 |
0.01 |
0.9 |
190000 |
15000 |
167119 |
0.01 |
0.2 |
200000 |
15000 |
33887 |
0.01 |
0.3 |
200000 |
15000 |
86791 |
0.01 |
0.4 |
200000 |
15000 |
116696 |
0.01 |
0.5 |
200000 |
15000 |
136107 |
0.01 |
0.6 |
200000 |
15000 |
149913 |
0.01 |
0.7 |
200000 |
15000 |
160474 |
0.01 |
0.8 |
200000 |
15000 |
169155 |
0.01 |
0.9 |
200000 |
15000 |
176984 |
0.01 |
0.2 |
210000 |
15000 |
42910 |
0.01 |
0.3 |
210000 |
15000 |
96125 |
0.01 |
0.4 |
210000 |
15000 |
126206 |
0.01 |
0.5 |
210000 |
15000 |
145732 |
0.01 |
0.6 |
210000 |
15000 |
159619 |
0.01 |
0.7 |
210000 |
15000 |
170241 |
0.01 |
0.8 |
210000 |
15000 |
178974 |
0.01 |
0.9 |
210000 |
15000 |
186849 |
0.01 |
0.2 |
220000 |
15000 |
51933 |
0.01 |
0.3 |
220000 |
15000 |
105459 |
0.01 |
0.4 |
220000 |
15000 |
135716 |
0.01 |
0.5 |
220000 |
15000 |
155356 |
0.01 |
0.6 |
220000 |
15000 |
169324 |
0.01 |
0.7 |
220000 |
15000 |
180009 |
0.01 |
0.8 |
220000 |
15000 |
188792 |
0.01 |
0.9 |
220000 |
15000 |
196713 |
0.01 |
0.2 |
230000 |
15000 |
60956 |
0.01 |
0.3 |
230000 |
15000 |
114794 |
0.01 |
0.4 |
230000 |
15000 |
145226 |
0.01 |
0.5 |
230000 |
15000 |
164980 |
0.01 |
0.6 |
230000 |
15000 |
179029 |
0.01 |
0.7 |
230000 |
15000 |
189776 |
0.01 |
0.8 |
230000 |
15000 |
198611 |
0.01 |
0.9 |
230000 |
15000 |
206578 |
0.01 |
0.2 |
240000 |
15000 |
69979 |
0.01 |
0.3 |
240000 |
15000 |
124128 |
0.01 |
0.4 |
240000 |
15000 |
154736 |
0.01 |
0.5 |
240000 |
15000 |
174604 |
0.01 |
0.6 |
240000 |
15000 |
188735 |
0.01 |
0.7 |
240000 |
15000 |
199544 |
0.01 |
0.8 |
240000 |
15000 |
208429 |
0.01 |
0.9 |
240000 |
15000 |
216442 |
0.01 |
0.2 |
250000 |
15000 |
79002 |
0.01 |
0.3 |
250000 |
15000 |
133462 |
0.01 |
0.4 |
250000 |
15000 |
164246 |
0.01 |
0.5 |
250000 |
15000 |
184228 |
0.01 |
0.6 |
250000 |
15000 |
198440 |
0.01 |
0.7 |
250000 |
15000 |
209311 |
0.01 |
0.8 |
250000 |
15000 |
218248 |
0.01 |
0.9 |
250000 |
15000 |
226307 |
0.01 |
0.2 |
260000 |
15000 |
88025 |
0.01 |
0.3 |
260000 |
15000 |
142796 |
0.01 |
0.4 |
260000 |
15000 |
173756 |
0.01 |
0.5 |
260000 |
15000 |
193852 |
0.01 |
0.6 |
260000 |
15000 |
208145 |
0.01 |
0.7 |
260000 |
15000 |
219079 |
0.01 |
0.8 |
260000 |
15000 |
228067 |
0.01 |
0.9 |
260000 |
15000 |
236172 |
0.01 |
0.2 |
270000 |
15000 |
97048 |
0.01 |
0.3 |
270000 |
15000 |
152130 |
0.01 |
0.4 |
270000 |
15000 |
183266 |
0.01 |
0.5 |
270000 |
15000 |
203476 |
0.01 |
0.6 |
270000 |
15000 |
217851 |
0.01 |
0.7 |
270000 |
15000 |
228846 |
0.01 |
0.8 |
270000 |
15000 |
237885 |
0.01 |
0.9 |
270000 |
15000 |
246036 |
0.01 |
0.2 |
280000 |
15000 |
106070 |
0.01 |
0.3 |
280000 |
15000 |
161464 |
0.01 |
0.4 |
280000 |
15000 |
192776 |
0.01 |
0.5 |
280000 |
15000 |
213101 |
0.01 |
0.6 |
280000 |
15000 |
227556 |
0.01 |
0.7 |
280000 |
15000 |
238614 |
0.01 |
0.8 |
280000 |
15000 |
247704 |
0.01 |
0.9 |
280000 |
15000 |
255901 |
0.01 |
0.8 |
50000 |
25000 |
3733 |
0.01 |
0.9 |
50000 |
25000 |
15476 |
0.01 |
0.7 |
60000 |
25000 |
478 |
0.01 |
0.8 |
60000 |
25000 |
13551 |
0.01 |
0.9 |
60000 |
25000 |
25341 |
0.01 |
0.7 |
70000 |
25000 |
10246 |
0.01 |
0.8 |
70000 |
25000 |
23370 |
0.01 |
0.9 |
70000 |
25000 |
35205 |
0.01 |
0.6 |
80000 |
25000 |
3986 |
0.01 |
0.7 |
80000 |
25000 |
20013 |
0.01 |
0.8 |
80000 |
25000 |
33188 |
0.01 |
0.9 |
80000 |
25000 |
45070 |
0.01 |
0.6 |
90000 |
25000 |
13691 |
0.01 |
0.7 |
90000 |
25000 |
29781 |
0.01 |
0.8 |
90000 |
25000 |
43007 |
0.01 |
0.9 |
90000 |
25000 |
54934 |
0.01 |
0.5 |
100000 |
25000 |
2282 |
0.01 |
0.6 |
100000 |
25000 |
23397 |
0.01 |
0.7 |
100000 |
25000 |
39548 |
0.01 |
0.8 |
100000 |
25000 |
52826 |
0.01 |
0.9 |
100000 |
25000 |
64799 |
0.01 |
0.5 |
110000 |
25000 |
11906 |
0.01 |
0.6 |
110000 |
25000 |
33102 |
0.01 |
0.7 |
110000 |
25000 |
49316 |
0.01 |
0.8 |
110000 |
25000 |
62644 |
0.01 |
0.9 |
110000 |
25000 |
74664 |
0.01 |
0.5 |
120000 |
25000 |
21530 |
0.01 |
0.6 |
120000 |
25000 |
42807 |
0.01 |
0.7 |
120000 |
25000 |
59083 |
0.01 |
0.8 |
120000 |
25000 |
72463 |
0.01 |
0.9 |
120000 |
25000 |
84528 |
0.01 |
0.4 |
130000 |
25000 |
1124 |
0.01 |
0.5 |
130000 |
25000 |
31154 |
0.01 |
0.6 |
130000 |
25000 |
52513 |
0.01 |
0.7 |
130000 |
25000 |
68851 |
0.01 |
0.8 |
130000 |
25000 |
82281 |
0.01 |
0.9 |
130000 |
25000 |
94393 |
0.01 |
0.4 |
140000 |
25000 |
10634 |
0.01 |
0.5 |
140000 |
25000 |
40778 |
0.01 |
0.6 |
140000 |
25000 |
62218 |
0.01 |
0.7 |
140000 |
25000 |
78618 |
0.01 |
0.8 |
140000 |
25000 |
92100 |
0.01 |
0.9 |
140000 |
25000 |
104257 |
0.01 |
0.4 |
150000 |
25000 |
20144 |
0.01 |
0.5 |
150000 |
25000 |
50403 |
0.01 |
0.6 |
150000 |
25000 |
71924 |
0.01 |
0.7 |
150000 |
25000 |
88386 |
0.01 |
0.8 |
150000 |
25000 |
101918 |
0.01 |
0.9 |
150000 |
25000 |
114122 |
0.01 |
0.4 |
160000 |
25000 |
29654 |
0.01 |
0.5 |
160000 |
25000 |
60027 |
0.01 |
0.6 |
160000 |
25000 |
81629 |
0.01 |
0.7 |
160000 |
25000 |
98153 |
0.01 |
0.8 |
160000 |
25000 |
111737 |
0.01 |
0.9 |
160000 |
25000 |
123987 |
0.01 |
0.4 |
170000 |
25000 |
39164 |
0.01 |
0.5 |
170000 |
25000 |
69651 |
0.01 |
0.6 |
170000 |
25000 |
91334 |
0.01 |
0.7 |
170000 |
25000 |
107921 |
0.01 |
0.8 |
170000 |
25000 |
121555 |
0.01 |
0.9 |
170000 |
25000 |
133851 |
0.01 |
0.3 |
180000 |
25000 |
1530 |
0.01 |
0.4 |
180000 |
25000 |
48674 |
0.01 |
0.5 |
180000 |
25000 |
79275 |
0.01 |
0.6 |
180000 |
25000 |
101040 |
0.01 |
0.7 |
180000 |
25000 |
117688 |
0.01 |
0.8 |
180000 |
25000 |
131374 |
0.01 |
0.9 |
180000 |
25000 |
143716 |
0.01 |
0.3 |
190000 |
25000 |
10864 |
0.01 |
0.4 |
190000 |
25000 |
58184 |
0.01 |
0.5 |
190000 |
25000 |
88899 |
0.01 |
0.6 |
190000 |
25000 |
110745 |
0.01 |
0.7 |
190000 |
25000 |
127456 |
0.01 |
0.8 |
190000 |
25000 |
141193 |
0.01 |
0.9 |
190000 |
25000 |
153581 |
0.01 |
0.3 |
200000 |
25000 |
20198 |
0.01 |
0.4 |
200000 |
25000 |
67694 |
0.01 |
0.5 |
200000 |
25000 |
98523 |
0.01 |
0.6 |
200000 |
25000 |
120450 |
0.01 |
0.7 |
200000 |
25000 |
137223 |
0.01 |
0.8 |
200000 |
25000 |
151011 |
0.01 |
0.9 |
200000 |
25000 |
163445 |
0.01 |
0.3 |
210000 |
25000 |
29532 |
0.01 |
0.4 |
210000 |
25000 |
77204 |
0.01 |
0.5 |
210000 |
25000 |
108148 |
0.01 |
0.6 |
210000 |
25000 |
130156 |
0.01 |
0.7 |
210000 |
25000 |
146991 |
0.01 |
0.8 |
210000 |
25000 |
160830 |
0.01 |
0.9 |
210000 |
25000 |
173310 |
0.01 |
0.3 |
220000 |
25000 |
38866 |
0.01 |
0.4 |
220000 |
25000 |
86714 |
0.01 |
0.5 |
220000 |
25000 |
117772 |
0.01 |
0.6 |
220000 |
25000 |
139861 |
0.01 |
0.7 |
220000 |
25000 |
156758 |
0.01 |
0.8 |
220000 |
25000 |
170648 |
0.01 |
0.9 |
220000 |
25000 |
183174 |
0.01 |
0.3 |
230000 |
25000 |
48200 |
0.01 |
0.4 |
230000 |
25000 |
96224 |
0.01 |
0.5 |
230000 |
25000 |
127396 |
0.01 |
0.6 |
230000 |
25000 |
149567 |
0.01 |
0.7 |
230000 |
25000 |
166526 |
0.01 |
0.8 |
230000 |
25000 |
180467 |
0.01 |
0.9 |
230000 |
25000 |
193039 |
0.01 |
0.3 |
240000 |
25000 |
57534 |
0.01 |
0.4 |
240000 |
25000 |
105734 |
0.01 |
0.5 |
240000 |
25000 |
137020 |
0.01 |
0.6 |
240000 |
25000 |
159272 |
0.01 |
0.7 |
240000 |
25000 |
176293 |
0.01 |
0.8 |
240000 |
25000 |
190285 |
0.01 |
0.9 |
240000 |
25000 |
202904 |
0.01 |
0.3 |
250000 |
25000 |
66868 |
0.01 |
0.4 |
250000 |
25000 |
115244 |
0.01 |
0.5 |
250000 |
25000 |
146644 |
0.01 |
0.6 |
250000 |
25000 |
168977 |
0.01 |
0.7 |
250000 |
25000 |
186061 |
0.01 |
0.8 |
250000 |
25000 |
200104 |
0.01 |
0.9 |
250000 |
25000 |
212768 |
0.01 |
0.3 |
260000 |
25000 |
76202 |
0.01 |
0.4 |
260000 |
25000 |
124754 |
0.01 |
0.5 |
260000 |
25000 |
156268 |
0.01 |
0.6 |
260000 |
25000 |
178683 |
0.01 |
0.7 |
260000 |
25000 |
195828 |
0.01 |
0.8 |
260000 |
25000 |
209922 |
0.01 |
0.9 |
260000 |
25000 |
222633 |
0.01 |
0.3 |
270000 |
25000 |
85536 |
0.01 |
0.4 |
270000 |
25000 |
134264 |
0.01 |
0.5 |
270000 |
25000 |
165893 |
0.01 |
0.6 |
270000 |
25000 |
188388 |
0.01 |
0.7 |
270000 |
25000 |
205596 |
0.01 |
0.8 |
270000 |
25000 |
219741 |
0.01 |
0.9 |
270000 |
25000 |
232497 |
0.01 |
0.2 |
280000 |
25000 |
8357 |
0.01 |
0.3 |
280000 |
25000 |
94871 |
0.01 |
0.4 |
280000 |
25000 |
143774 |
0.01 |
0.5 |
280000 |
25000 |
175517 |
0.01 |
0.6 |
280000 |
25000 |
198093 |
0.01 |
0.7 |
280000 |
25000 |
215363 |
0.01 |
0.8 |
280000 |
25000 |
229560 |
0.01 |
0.9 |
280000 |
25000 |
242362 |
0.01 |
0.9 |
50000 |
35000 |
1937 |
0.01 |
0.9 |
60000 |
35000 |
11802 |
0.01 |
0.8 |
70000 |
35000 |
5226 |
0.01 |
0.9 |
70000 |
35000 |
21666 |
0.01 |
0.8 |
80000 |
35000 |
15044 |
0.01 |
0.9 |
80000 |
35000 |
31531 |
0.01 |
0.7 |
90000 |
35000 |
6530 |
0.01 |
0.8 |
90000 |
35000 |
24863 |
0.01 |
0.9 |
90000 |
35000 |
41396 |
0.01 |
0.7 |
100000 |
35000 |
16298 |
0.01 |
0.8 |
100000 |
35000 |
34682 |
0.01 |
0.9 |
100000 |
35000 |
51260 |
0.01 |
0.6 |
110000 |
35000 |
3639 |
0.01 |
0.7 |
110000 |
35000 |
26065 |
0.01 |
0.8 |
110000 |
35000 |
44500 |
0.01 |
0.9 |
110000 |
35000 |
61125 |
0.01 |
0.6 |
120000 |
35000 |
13345 |
0.01 |
0.7 |
120000 |
35000 |
35833 |
0.01 |
0.8 |
120000 |
35000 |
54319 |
0.01 |
0.9 |
120000 |
35000 |
70989 |
0.01 |
0.6 |
130000 |
35000 |
23050 |
0.01 |
0.7 |
130000 |
35000 |
45600 |
0.01 |
0.8 |
130000 |
35000 |
64137 |
0.01 |
0.9 |
130000 |
35000 |
80854 |
0.01 |
0.5 |
140000 |
35000 |
3195 |
0.01 |
0.6 |
140000 |
35000 |
32755 |
0.01 |
0.7 |
140000 |
35000 |
55368 |
0.01 |
0.8 |
140000 |
35000 |
73956 |
0.01 |
0.9 |
140000 |
35000 |
90719 |
0.01 |
0.5 |
150000 |
35000 |
12819 |
0.01 |
0.6 |
150000 |
35000 |
42461 |
0.01 |
0.7 |
150000 |
35000 |
65135 |
0.01 |
0.8 |
150000 |
35000 |
83774 |
0.01 |
0.9 |
150000 |
35000 |
100583 |
0.01 |
0.5 |
160000 |
35000 |
22443 |
0.01 |
0.6 |
160000 |
35000 |
52166 |
0.01 |
0.7 |
160000 |
35000 |
74903 |
0.01 |
0.8 |
160000 |
35000 |
93593 |
0.01 |
0.9 |
160000 |
35000 |
110448 |
0.01 |
0.5 |
170000 |
35000 |
32067 |
0.01 |
0.6 |
170000 |
35000 |
61871 |
0.01 |
0.7 |
170000 |
35000 |
84670 |
0.01 |
0.8 |
170000 |
35000 |
103411 |
0.01 |
0.9 |
170000 |
35000 |
120312 |
0.01 |
0.5 |
180000 |
35000 |
41691 |
0.01 |
0.6 |
180000 |
35000 |
71577 |
0.01 |
0.7 |
180000 |
35000 |
94438 |
0.01 |
0.8 |
180000 |
35000 |
113230 |
0.01 |
0.9 |
180000 |
35000 |
130177 |
0.01 |
0.4 |
190000 |
35000 |
9182 |
0.01 |
0.5 |
190000 |
35000 |
51315 |
0.01 |
0.6 |
190000 |
35000 |
81282 |
0.01 |
0.7 |
190000 |
35000 |
104205 |
0.01 |
0.8 |
190000 |
35000 |
123049 |
0.01 |
0.9 |
190000 |
35000 |
140042 |
0.01 |
0.4 |
200000 |
35000 |
18692 |
0.01 |
0.5 |
200000 |
35000 |
60940 |
0.01 |
0.6 |
200000 |
35000 |
90988 |
0.01 |
0.7 |
200000 |
35000 |
113973 |
0.01 |
0.8 |
200000 |
35000 |
132867 |
0.01 |
0.9 |
200000 |
35000 |
149906 |
0.01 |
0.4 |
210000 |
35000 |
28201 |
0.01 |
0.5 |
210000 |
35000 |
70564 |
0.01 |
0.6 |
210000 |
35000 |
100693 |
0.01 |
0.7 |
210000 |
35000 |
123740 |
0.01 |
0.8 |
210000 |
35000 |
142686 |
0.01 |
0.9 |
210000 |
35000 |
159771 |
0.01 |
0.4 |
220000 |
35000 |
37711 |
0.01 |
0.5 |
220000 |
35000 |
80188 |
0.01 |
0.6 |
220000 |
35000 |
110398 |
0.01 |
0.7 |
220000 |
35000 |
133508 |
0.01 |
0.8 |
220000 |
35000 |
152504 |
0.01 |
0.9 |
220000 |
35000 |
169636 |
0.01 |
0.4 |
230000 |
35000 |
47221 |
0.01 |
0.5 |
230000 |
35000 |
89812 |
0.01 |
0.6 |
230000 |
35000 |
120104 |
0.01 |
0.7 |
230000 |
35000 |
143275 |
0.01 |
0.8 |
230000 |
35000 |
162323 |
0.01 |
0.9 |
230000 |
35000 |
179500 |
0.01 |
0.4 |
240000 |
35000 |
56731 |
0.01 |
0.5 |
240000 |
35000 |
99436 |
0.01 |
0.6 |
240000 |
35000 |
129809 |
0.01 |
0.7 |
240000 |
35000 |
153043 |
0.01 |
0.8 |
240000 |
35000 |
172141 |
0.01 |
0.9 |
240000 |
35000 |
189365 |
0.01 |
0.3 |
250000 |
35000 |
275 |
0.01 |
0.4 |
250000 |
35000 |
66241 |
0.01 |
0.5 |
250000 |
35000 |
109060 |
0.01 |
0.6 |
250000 |
35000 |
139514 |
0.01 |
0.7 |
250000 |
35000 |
162810 |
0.01 |
0.8 |
250000 |
35000 |
181960 |
0.01 |
0.9 |
250000 |
35000 |
199229 |
0.01 |
0.3 |
260000 |
35000 |
9609 |
0.01 |
0.4 |
260000 |
35000 |
75751 |
0.01 |
0.5 |
260000 |
35000 |
118685 |
0.01 |
0.6 |
260000 |
35000 |
149220 |
0.01 |
0.7 |
260000 |
35000 |
172578 |
0.01 |
0.8 |
260000 |
35000 |
191778 |
0.01 |
0.9 |
260000 |
35000 |
209094 |
0.01 |
0.3 |
270000 |
35000 |
18943 |
0.01 |
0.4 |
270000 |
35000 |
85261 |
0.01 |
0.5 |
270000 |
35000 |
128309 |
0.01 |
0.6 |
270000 |
35000 |
158925 |
0.01 |
0.7 |
270000 |
35000 |
182345 |
0.01 |
0.8 |
270000 |
35000 |
201597 |
0.01 |
0.9 |
270000 |
35000 |
218959 |
0.01 |
0.3 |
280000 |
35000 |
28277 |
0.01 |
0.4 |
280000 |
35000 |
94771 |
0.01 |
0.5 |
280000 |
35000 |
137933 |
0.01 |
0.6 |
280000 |
35000 |
168631 |
0.01 |
0.7 |
280000 |
35000 |
192113 |
0.01 |
0.8 |
280000 |
35000 |
211416 |
0.01 |
0.9 |
280000 |
35000 |
228823 |
0.01 |
0.9 |
70000 |
45000 |
8128 |
0.01 |
0.9 |
80000 |
45000 |
17992 |
0.01 |
0.8 |
90000 |
45000 |
6719 |
0.01 |
0.9 |
90000 |
45000 |
27857 |
0.01 |
0.8 |
100000 |
45000 |
16537 |
0.01 |
0.9 |
100000 |
45000 |
37721 |
0.01 |
0.7 |
110000 |
45000 |
2815 |
0.01 |
0.8 |
110000 |
45000 |
26356 |
0.01 |
0.9 |
110000 |
45000 |
47586 |
0.01 |
0.7 |
120000 |
45000 |
12582 |
0.01 |
0.8 |
120000 |
45000 |
36175 |
0.01 |
0.9 |
120000 |
45000 |
57451 |
0.01 |
0.7 |
130000 |
45000 |
22350 |
0.01 |
0.8 |
130000 |
45000 |
45993 |
0.01 |
0.9 |
130000 |
45000 |
67315 |
0.01 |
0.6 |
140000 |
45000 |
3293 |
0.01 |
0.7 |
140000 |
45000 |
32117 |
0.01 |
0.8 |
140000 |
45000 |
55812 |
0.01 |
0.9 |
140000 |
45000 |
77180 |
0.01 |
0.6 |
150000 |
45000 |
12998 |
0.01 |
0.7 |
150000 |
45000 |
41885 |
0.01 |
0.8 |
150000 |
45000 |
65630 |
0.01 |
0.9 |
150000 |
45000 |
87044 |
0.01 |
0.6 |
160000 |
45000 |
22703 |
0.01 |
0.7 |
160000 |
45000 |
51652 |
0.01 |
0.8 |
160000 |
45000 |
75449 |
0.01 |
0.9 |
160000 |
45000 |
96909 |
0.01 |
0.6 |
170000 |
45000 |
32409 |
0.01 |
0.7 |
170000 |
45000 |
61420 |
0.01 |
0.8 |
170000 |
45000 |
85267 |
0.01 |
0.9 |
170000 |
45000 |
106774 |
0.01 |
0.5 |
180000 |
45000 |
4107 |
0.01 |
0.6 |
180000 |
45000 |
42114 |
0.01 |
0.7 |
180000 |
45000 |
71187 |
0.01 |
0.8 |
180000 |
45000 |
95086 |
0.01 |
0.9 |
180000 |
45000 |
116638 |
0.01 |
0.5 |
190000 |
45000 |
13731 |
0.01 |
0.6 |
190000 |
45000 |
51819 |
0.01 |
0.7 |
190000 |
45000 |
80955 |
0.01 |
0.8 |
190000 |
45000 |
104905 |
0.01 |
0.9 |
190000 |
45000 |
126503 |
0.01 |
0.5 |
200000 |
45000 |
23356 |
0.01 |
0.6 |
200000 |
45000 |
61525 |
0.01 |
0.7 |
200000 |
45000 |
90722 |
0.01 |
0.8 |
200000 |
45000 |
114723 |
0.01 |
0.9 |
200000 |
45000 |
136367 |
0.01 |
0.5 |
210000 |
45000 |
32980 |
0.01 |
0.6 |
210000 |
45000 |
71230 |
0.01 |
0.7 |
210000 |
45000 |
100490 |
0.01 |
0.8 |
210000 |
45000 |
124542 |
0.01 |
0.9 |
210000 |
45000 |
146232 |
0.01 |
0.5 |
220000 |
45000 |
42604 |
0.01 |
0.6 |
220000 |
45000 |
80936 |
0.01 |
0.7 |
220000 |
45000 |
110257 |
0.01 |
0.8 |
220000 |
45000 |
134360 |
0.01 |
0.9 |
220000 |
45000 |
156097 |
0.01 |
0.5 |
230000 |
45000 |
52228 |
0.01 |
0.6 |
230000 |
45000 |
90641 |
0.01 |
0.7 |
230000 |
45000 |
120025 |
0.01 |
0.8 |
230000 |
45000 |
144179 |
0.01 |
0.9 |
230000 |
45000 |
165961 |
0.01 |
0.4 |
240000 |
45000 |
7729 |
0.01 |
0.5 |
240000 |
45000 |
61852 |
0.01 |
0.6 |
240000 |
45000 |
100346 |
0.01 |
0.7 |
240000 |
45000 |
129792 |
0.01 |
0.8 |
240000 |
45000 |
153997 |
0.01 |
0.9 |
240000 |
45000 |
175826 |
0.01 |
0.4 |
250000 |
45000 |
17239 |
0.01 |
0.5 |
250000 |
45000 |
71476 |
0.01 |
0.6 |
250000 |
45000 |
110052 |
0.01 |
0.7 |
250000 |
45000 |
139560 |
0.01 |
0.8 |
250000 |
45000 |
163816 |
0.01 |
0.9 |
250000 |
45000 |
185691 |
0.01 |
0.4 |
260000 |
45000 |
26749 |
0.01 |
0.5 |
260000 |
45000 |
81101 |
0.01 |
0.6 |
260000 |
45000 |
119757 |
0.01 |
0.7 |
260000 |
45000 |
149327 |
0.01 |
0.8 |
260000 |
45000 |
173634 |
0.01 |
0.9 |
260000 |
45000 |
195555 |
0.01 |
0.4 |
270000 |
45000 |
36259 |
0.01 |
0.5 |
270000 |
45000 |
90725 |
0.01 |
0.6 |
270000 |
45000 |
129462 |
0.01 |
0.7 |
270000 |
45000 |
159095 |
0.01 |
0.8 |
270000 |
45000 |
183453 |
0.01 |
0.9 |
270000 |
45000 |
205420 |
0.01 |
0.4 |
280000 |
45000 |
45769 |
0.01 |
0.5 |
280000 |
45000 |
100349 |
0.01 |
0.6 |
280000 |
45000 |
139168 |
0.01 |
0.7 |
280000 |
45000 |
168862 |
0.01 |
0.8 |
280000 |
45000 |
193272 |
0.01 |
0.9 |
280000 |
45000 |
215284 |
Conclusion
Under the most plausible scenarios corresponding to US & South Korea costs & success rates, and the high heritabilities indicated by available evidence, dog cloning is profitable in theory. This is consistent with the reports from South Korea that dog cloning is profitable in practice.
So dog cloning for police/military use is profitable in both theory & practice.
The benefits of cloning or using partial predictors of extreme outliers is general, and will be applicable to many other areas, especially where screening/training is lengthy & expensive.
See Also
Embryo selection for complex traits (considers many similar scenarios with polygenic scores rather than cloning)
Appendix
Dog Heritabilities
Notes on reading reviews & meta-analyses on the psychometric properties & heritabilities of dog behavioral traits, particularly for working dogs. Dog heritabilities might be expected to be low in the context of considering dogs of the same breed (as would be relevant to a breeding or training context): heavy selective breeding would tend to reduce within-breed heritabilities (while increasing group heritability).
Overall, heritabilities appear to differ by breed and be quite low (say, closer to 25% than to the human average of >50%) but the psychometric properties of dog behavioral tests also appear to be poor, with low item counts, reliabilities, test-retests, and predictive power, rater/judge effects, and little use of latent factors to extract more reliable measures, suggesting considerable total measurement error and thus considerable underestimation of prediction/heritabilities. Possibly dog heritabilities are much closer to human heritabilities than they seem.
On measurement error and heritability:
Wilsson & Sundgren 199729ya, “The use of a behavior test for selection of dogs for service and breeding. II. Heritability for tested parameters and effect of selection based on service dog characteristics” notes that their use of factor analysis on multiple tests to derive an index value yields higher heritability estimates than the raw tests (compare Table 1 with Table 3):
It is remarkable that the heritability for the calculated index value and for the four factors from the factor analysis is comparatively high (Tables 2 and 3). This is normally expected to hold true for single well-defined characteristics. This study, however, shows a higher heritability for complex behavior systems. The more complex parameters, index values and the four factors from the factor analysis show a higher heritability than most of the single characteristics that they are based on. One possible explanation is that the evaluated characteristics overlap and a higher degree of confidence can be achieved if the information from the evaluated characteristics are pooled. The probability of this explanation is further enhanced by the relatively high positive phenotypic correlation maintained between the characteristics (Wilsson and Sundgren, 199630ya). Goddard & Beilharz 1982 show a heritability as high as 0.44 to predict a dog’s ability to become a guide dog for the blind. The characteristic used was defined as “success”. Mackenzie et al 1985 calculated the heritability of “temperament” to be 0.51 in 575 military dogs. In both cases the high heritability figures were calculated on a characteristic that summarises complex behavior systems. With regards to this, it should be pointed out that the characteristic “temperament” in the study of Mackenzie et al 198541ya is defined as a military dog’s suitability for protection and tracking and must not be considered synonymous with the definition of temperament used in this study.
Jones & Gosling 200521ya, “Temperament and personality in dogs (Canis familiaris): a review and evaluation of past research”
If temperament tests are to be of any value, they must be shown to be both reliable and valid. Reliability is a prerequisite for validity, and so we review the evidence for reliability first.The first thing to conclude about reliability is that with the few exceptions we will discuss in more detail, researchers have rarely reported reliability of any kind.
…Table 3 is divided into two types of reliability: inter-observer agreement and test–retest reliability. The studies using inter-observer agreement used the traditional method of analysis in which each variable is analyzed across subjects (instead of computing reliability within subjects). The correlations suggest that inter-judge agreement varies greatly across studies and traits. Although strong agreement is possible, it is by no means guaranteed; the sample-weighted mean agreement correlation was .60, but the agreement correlations ranged .00–.86…Two studies appear in the test–retest reliability category, listed in the lower section of Table 3, examining the correlation between scores when dogs were tested twice. One of these studies, by Goddard & Beilharz 198640ya, reveals Activity level is reliable from test to test, but that this reliability decreases as puppies age. The other study, by Netto & Planta 199729ya, shows a strong mean correlation, but also included many insignificant correlations. Closer examination reveals that many of the Kappa coefficients reported are zero, indicating no reliability. However, this is partially an artifact of the testing situation because the subtests were not intended to elicit Aggression, so it makes little sense to assess the reliability with which they elicited aggression. Of the subtests in this study which were intended to elicit aggression, the lowest Kappa coefficient is -.03 for reaction to an artificial hand taking away food, and reaction to a stranger being mildly threatening when meeting the dog’s handler. However, Netto and Planta’s study should be commended for fully reporting their reliability data; when interpreted against an understanding of the testing situations, these are data are very valuable. Table 4 summarizes all the internal consistency estimates reported in the studies reviewed. Internal consistency measures estimate the degree to which items on a scale assess the same construct. In human personality research, they are often used following factor analyses to determine the internal coherence of the derived factors. Of the 16 studies in our review to focus on factor analysis, only three reported internal consistency. Two of these studies (Hsu and Serpell, 200323ya; Serpell and Hsu, 200125ya) gathered data using questionnaires with 5-point frequency (Likert) scales; the third (Seksel et al 199927ya) used a 100-point scale. One additional study that did not focus on factor analysis also reported internal consistency (Gosling et al 200323yaa) and is included in Table 4. Internal consistency varied greatly across studies and factors, ranging from .42 for “Handling”, to .93 for “Stranger-directed Aggression”. Although high consistency is possible, it is by no means guaranteed. Nonetheless, the internal consistency measures had a weighted mean of .76, well within the limits acceptable in most human personality research (John and Benet-Martinez, 200026ya)
Overall, the evidence for convergent validity is reasonably promising, with the various estimates averaging about .40 across the nine dimensions examined here.
Cauchoix et al 2018, “The repeatability of cognitive performance: a meta-analysis” finds across 25 animal species “mean R estimates ranging between 0.15 and 0.28.”
“Personality and performance in military working dogs: Reliability and predictive validity of behavioral tests”, Sinn et al 201016ya: finds considerable inter-rater disagreement, and low long-term test-retest reliability
Hradecká 201511ya, “Heritability of behavioral traits in domestic dogs: A meta-analysis”, meta-analyzes global heritabilities across various domains as 0.15/0.10/0.15/0.09/0.12; narrowing down to the “Psychical” domain of traits which seem to be most key to SF training, and the breeds which are most often employed: Belgian Shepherd Dog, 0.13; German Shepherd Dog: 0.12; Labrador Retriever: 0.07. These are low but Hradecká 201511ya comments on the high unreliability of the measurements being used in most dog heritability studies, which will have the effect of extremely reducing heritability estimates:
Multifactorial analysis revealed that values of heritability of behavioral traits were affected not only by biotic factors such as age and sex, suggesting importance of experience, training, and learning (eg. Karjalainen et al 199630ya; Meyer et al 201214ya), but also by abiotic factors such as testing month, weather during the testing, place of testing, judges, etc. This questioned the methods of evaluating heritability…evaluations of the behavioral traits are often difficult due to the lack of testing repeatability between and also within judges. Performance testing is usually subjective as significantly different scores are given by the judges as shown, for example, in Finnish Spitz (Karjalainen et al 199630ya).
Karjalainen et al 199630ya. “Environmental effects and genetic parameters for measurements of hunting performance in the Finnish Spitz” (test-retests are all r = 0.10–0.20!)
For perspective, if we assume a test-retest as much as 0.20, and we correct the Belgian Shepherd Dog mean psychical heritability of 0.13 for the test-retest alone (which is only one form of measurement error), the Spearman correction yields a true heritability of 0.20/√0.13 = 0.55.
Reviews:
van den Berg 2017, “Genetics of dog behavior”
The dog genetic studies reviewed in this chapter used more subjective phenotypic measures. Most heritability studies used phenotypes based on the behavior of dogs in test batteries. Jones & Gosling 200521ya have reviewed studies of canine personality and noted that, “In theory, test batteries were the closest to achieving objectivity, but in practice the levels of objectivity actually attained varied substantially.” The molecular genetic studies mostly used even more subjective measures such as owner-report questionnaires and expert ratings (experts being veterinarians, trainers, or dog obedience judges). Owner and expert ratings may be influenced by a variety of factors other than the behavior of the dog, eg. owner personality and expectations of typical dog behavior. Intuitively, the use of specific and objective metrics in genetic studies seems preferable. However, behavior of dogs in a test battery may not be representative of their behavior in everyday life and it is often unclear what exactly is being measured. Van den Berg and colleagues used three methods for measuring canine aggressive behavior: a behavioral test of the dog (van den Berg et al ., 200323ya), a questionnaire for the dog owner (van den Berg et al ., 200620ya), and a personal interview with the dog owner (van den Berg et al ., 200323ya , 200620ya). The most promising heritability estimates (ie. high heritability with low standard errors) were obtained for the owner impressions collected during the personal interview (Liinamo et al ., 2007). This is rather surprising because of the subjectivity of these phenotypes. Large coordinated projects, such as the European LUPA consortium, make an effort to clarify dog behavioral phenotypes by following standard procedures to describe dog behavior (Lequarré et al ., 201115ya). This is of great value for progress in canine behavioral genetics.
“Canine Behavioral Genetics—A Review”, Mackenzie 1986
Table 2: Proportion of total variance due to breed differences between Basenjis and Cocker Spaniels (after Scott & Fuller 1965)
Variable
Proportion
Posture in Pavlov stand
0.43
Investigative behavior in Pavlov stand
0.46
Escape attempts while in Pavlov stand
0.56
Human avoidance and vocalization at 5 weeks
0.59
Playful fighting at 13–15 weeks
0.42
Leash fighting
0.77
Docility during sit-training
0.48
Running time for long barrier
0.78
Vocalization on U-shaped barrier
0.47
Table 3: Heritability estimates in Dachshunds (after Geiger 197353ya)
Trait
Sire
Dam
Hare tracking
0.03
0.46
Nose
0.01
0.39
Seek
0.00
0.41
Obedience
0.01
0.19
…G. Geiger investigated the breeding-book of Dachshunds in Germany in 197353ya and found the scores better distributed than the data studied by Sacher, perhaps due to the 12-point system used as opposed to the 4-point system used in the pointer prize classes [ie. measurement error/range restriction]. He conducted a 3-level nested analysis of variance on 1,463 full-sub & half-sib progeny of 21 sires. In contrast to the earlier findings of Humphrey & Warner 193492ya, King 195472ya and Mahut 195868ya, his results showed maternal effects but no effect due to sex. The heritabilities are shown in Table 3 (Geiger 197353ya, cited in Pfleiderer-Hogner 197947ya).
A second study of additive genetic variation in 197353ya came from the Army Dog Training Center in Solleftea, Sweden. C. Reuterwall and N. Ryman reported on their study of 958 German Shepherds from 29 sires. The 8 behavioral traits studied were labeled A–H:
Trait A was termed “Affability” (tested by having an unknown person confront the dog);
Trait B was termed “Disposition for Self Defense” (tested by having an unknown person attack the dog);
Trait C was termed “Disposition for Self Defense and Defense of Handler” (tested by having an unknown person attack the dog and handler);
Trait D was termed “Disposition for Fighting in a Playful Manner” (tested by asking the dog to fight for a sleeve or stick);
Trait E was termed “Courage” (tested by having a man-shaped figure approach the dog);
Trait F was termed “Ability to Meet with Sudden Strong Auditory Disturbance” (tested by firing shots at some distance and making a noise with tin cans just behind the dog);
Trait G was termed “Disposition for Forgetting Unpleasant Incidents” (tested by scaring the dog at a certain place and then asking the dog to pass the place again);
Trait H was termed “Adaptiveness to Different Situations and Environments” (tested by observations during the other parts of the test).
In contrast to Geiger’s findings, Reuterwall and Ryman reported significant differences between the sexes, males handling noise (Trait F) better and exhibiting more controlled defense (part of Trait C) and playful fighting (Trait D). Sex differences had also been noted by Humphrey & Warner 193492ya, King 195472ya and Mahut 195868ya. Reuterwall and Ryman noted that, in all 380 the traits studied, the additive genetic variation was small (Reuterwall & Ryman 197353ya). The heritability estimates listed in Table 4 were reported by Willis based on the information found in Reuterwall and Ryman (Willis 197749ya). It should be noted that the scores used by Reuterwall and Ryman were transformed and extremely complex. Some workers in Sweden today, working on the genetics of the breeding program at the Statens Hundskola, feel that the findings of Reuterwall and Ryman’s study are based on scores too complex to have much meaning (L. Falt 198244ya, personal communication).
Table 4: Heritabilities in German Shepherds (after Reuterwall & Ryman 197353ya)
Trait
Males
Females
A [Affability]
0.17
0.09
B [Disposition for self-defense]
0.11
0.26
C [Disposition for self-defense and defense of handler]
0.04
0.16
D [Disposition for fighting in a playful manner]
0.16
0.21
E [Courage]
0.05
0.13
F [Ability to meet with sudden strong auditory disturbance]
−0.04
0.15
G [Disposition for forgetting unpleasant incidents]
0.10
0.17
H [Adaptiveness to different situations and environments ]
0.00
0.04
The next year, M.E. Goddard and R.G. Beilharz stated their belief that fearfulness and dog distraction were heritable in Australian guide dogs (Goddard & Beilharz 197452ya). In 198244ya, Goddard and Beilharz reported further on the genetics of Australian guide dogs…Fearfulness emerged as the most important and most highly heritable component of success. Estimates of heritabilities based on scores of 394 Labrador Retrievers computed from sire components, dam components and the two combined are listed in Table 5 (Goddard & Beilharz 198244ya). In contrast to reports by Scott & Bielfelt 197650ya, Geiger 197353ya, and Scott & Fuller 196561ya, no strong maternal effects were evident (Goddard & Beilharz 198244ya).
Table 5: Heritability estimates in Australian Labradors (after Goddard & Beilharz 198244ya)
Trait
Sire
Dam
Combined
Success
0.46
0.42
0.44
Fear
0.67
0.25
0.46
Dog distraction
−0.04
0.23
0.09
Excitability
0.00
0.17
0.09
Health
0.40
0.10
0.25
Hip dysplasia
0.08
0.20
0.14
…Estimates of heritabilities based on scores of 249 Labrador Retrievers, calculated from combined sire and dam components, are listed in Table VI (Goddard & Beilharz 198343ya). Nervousness had the highest heritability and was the only trait with a statistically-significant sire component. Estimates of genetic correlations between the traits are listed in Table 7 (Goddard & Beilharz 198343ya). In contrast to other workers (Castleberry et al 197650ya; Bartlett 197650ya; Rosberg & Olausson 197650ya), Goddard & Beilharz 198343ya found no negative correlations between important traits. However, they did not list correlations for hip dysplasia. They also noted the importance of sex; females being more fearful and distracted by scents but less aggressive and distracted by dogs than males. Sex differences were also noted by Humphrey & Warner 193492ya, King 195472ya, Mahut 195868ya, Reuterwall & Ryman 197353ya and Pfleiderer-Hogner 197947ya. G. Queinnec, B. Queinnec and R. Darre reported on their work with French racing greyhounds (Queinnec et al 197452ya). Breeding values for greyhounds were based 40% on the animal’s own performance and 60% on the performance of its progeny, both over 3 racing seasons to account for repeatability.
Table 6: Heritability estimates in Australian Labradors (after Goddard & Beilharz 198343ya)
Trait
Heritability
Nervousness (N)
0.58
Suspicion (S)
0.10
Concentration (C)
0.28
Willingness (W)
0.22
Distraction (D)
0.08
Dog distraction (DD)
0.27
Nose distraction (ND)
0.00
Sound-shy (SS)
0.14
Hearing sensitivity (HS)
0.00
Body sensitivity (BS)
0.30
In 1975, the U.S. Army Biosensor Project reported a heritability estimate of 0.70 for their intermediate temperament evaluations. They also stated their intention to use heritability estimates of both hip dysplasia (previously estimated in their colony as 0.22) and temperament in the calculation of breeding values (Castleberry et al 1975). The following year, they reported the first known estimate of the genetic correlation between temperament and hip dysplasia (considered by many to be the two major problems in breeding dogs for military or police work). Before listing the estimate, they noted that previous dysplasia-free litters had shown undesirable temperaments. Their estimate of the phenotypic correlation between the two traits was −0.25 and that of the genetic correlation was −0.35 (Castleberry et al 1976). In 1976, C.R. Bartlett reported heritabilities and genetic correlations between traits studied in American guide dogs. The traits listed were hip dysplasia, body sensitivity (judged by how hard a jerk on the choke-chain leash the new dog could tolerate; low scores indicating a lack of sensitivity), ear sensitivity (judged by how loud a vocal correction the new dog required; low scores indicating lack of sensitivity), nose (olfactory acuity leading to distraction problems for all but the best trainers; low scores indicating greatest use of the nose), intelligence (the ability of the dog to understand things from its own viewpoint, not implying a willingness to obey; low scores indicating great intelligence, which may be a problem to all but the best trainers), willingness {willingness to do what the dog’s master asks of it, regardless of distractions; low scores indicating the most willing dogs), energy (activity versus laziness; low scores indicating active, energetic dogs), self right (the belief of the dog that it has a right to be where it is; negative scores indicating a tendency to give way to another), confidence (confidence shown with strange people or in strange environments; low scores indicating more confident dogs), fighting instinct (tendency to fight; low positive scores indicating the tendency to avoid fights, negative scores indicating even less tendency to fight, passing into submission) and protective instinct (a desire of the dog to protect its own; low positive scores indicating a dog which will speak if a stranger approaches its master with menace, but will not fight to protect the master). Heritability estimates of these traits, based on over 700 records for males and over 1000 records for females, both calculated by paternal half-sib analysis, are listed in Table 8 (Bartlett 197650ya)
Table 8: Heritability estimates in American guide dogs (after Bartlett 197650ya)
Trait
Males
Females
Combined
Hips
0.72
0.46
0.54
Body sensitivity
0.26
0.05
0.10
Ear sensitivity
0.49
0.14
0.25
Nose
0.30
0.05
0.12
Intelligence
0.17
−0.07
−0.06
Willingness
−0.14
−0.04
−0.03
Energy
−0.03
0.06
0.05
Self-right
0.15
0.25
0.22
Confidence
0.04
0.26
0.16
Fighting instinct
−0.05
−0.08
−0.04
Protective instinct
−0.21
−0.13
−0.12
Rosberg and Olausson reported low heritability estimates for mental traits in the dogs at the Swedish Army Dog Center in Solleftea, Sweden. All dogs included in the study were German Shepherds. Phenotypic correlations between the mental traits they were studying and hip dysplasia were small, but negative. Genetic correlations were negative, ranging up to −0.55, but the authors felt they were unreliable due to problems with the material studied (Rosberg & Olausson 197650ya). A study of the genetics of American guide dogs was completed in 197650ya by C. J. Pfaffenberger, J. P. Scott, J. L. Fuller, B. E. Ginsburg and S. W. Bielfelt. They followed up Scott & Fuller 1965’s work in behavior and obtained estimates of heritability for their puppy tests. The traits reported by Scott & Bielfelt 197650ya in their chapter on analysis of the puppy-testing program included the following: sit (three repetitions of a forced sit with a vocal command}; come (five repetitions of the handler moving away, kneeling down, calling the puppy by name, followed by the command “come” while clapping the hands); fetch (three repetitions of playful retrieving with vocal command); trained response (a complex score, indicating if the puppy was afraid of the tester or not, was over-excited or cooperated calmly, did or did not pay attention to moving objects, adjusted slowly or readily to the new environment, showed no curiosity or was curious about new objects and people, did or did not remember previous experience, tried to do what the tester wanted or not, and showed persistence or not in performing a task); willing in training (also a complex score, indicating if the puppy was fearful or at ease, afraid to move or moved freely, was indifferent or friendly to the tester, was unresponsive or responsive to encouragement, urinated or was continent, was upset by the new situation or was confident, and was obstinate or willing in its responses); body sensitivity (another complex score, indicating if the puppy stood erect or cowered, turned head away or not, looked at or away from the tester, showed pain by action or not, came back after pain or attempted to escape, tucked in the tail or not, wagged tail or not after pain, and growled or not when in pain); ear sensitivity (similar to body sensitivity, except in relation to sound instead of pain); new-experience response (similar to trained response, but this time an emotional response to novel stimuli, not training); willing in new experience (similar to willing in training, except related to novel stimuli instead of training); traffic (indicates if puppy can avoid a moving and stationary cart without becoming fearful); footing-crossing (indicates if puppy noticed differences in footing between curbs and metal patches in the sidewalk); closeness {how close the puppy passed to obstructions); heel (how well the puppy accepted leash training). 11 of the 13 traits, whose heritability estimates are listed in Table 11, had dam components much larger than the sire components, indicating strong maternal effects (Scott & Bielfelt 197650ya). This agrees with the findings of Scott & Fuller 196561ya and Geiger 197353ya. As part of the same study, J.L. Fuller examined the relationship between physical measurements and behavior. Once again, no substantial correlations were found (Fuller 197650ya).
Table 11: Heritability estimates for California guide dogs (after Scott & Bielfelt 197650ya)
Trait
Heritability
Sit
0.06
Come
0.14
Fetch
0.24
Trained response
0.08
Willing in training
0.12
Body sensitivity
0.16
Ear sensitivity
0.00
New-experience response
0.06
Willing new experience
0.24
Traffic
0.12
Footing-crossing
0.06
Closeness
0.04
Heel
0.10
Comparing Scott & Fuller 1965’s estimates with those of the U.S. Army Biosensor project (Castleberry et al 197551ya), it seems possible that certain components of behavior may be highly heritable. The failure of other workers to find high estimates may indicate that such estimates are quite sensitive to the quality of the tests, size of the samples and statistical methodology.
In 197947ya, M. Pfleiderer-Hogner estimated heritabilities of Schutzhund scores in Germany. She analyzed 2,046 test results in 1,291 German Shepherds from 37 sires, all tested animals being born in 197353ya. The four criteria studied were tracking, obedience, man-work and character. She found sex and the number of dogs competing in a given trial to be significant, but not age or month of trial. Sex differences were previously noted by Humphrey & Warner 193492ya, King 195472ya, Mahut 195868ya and Reuterwall & Ryman 197353ya. Estimates of heritabilities from sire components, dam components and their combination are listed in Table 12 (Pfleiderer-Hogner 197947ya).
Table 12: Heritability estimates for German Schutzhund scores (after Pfleiderer-Hogner 197947ya)
Trait
Sire
Dam
Combined
Tracking
0.01
0.20
0.10
Obedience
0.04
0.13
0.09
Man-work
0.04
0.07
0.06
Character
0.05
0.17
0.12
In 198244ya, L. Falt, L. Swenson and E. Wilsson reported their unpublished work on heritability estimates for behavioral traits studied at the National Dog School (Statens Hundskola) in Solleftea, Sweden. [Falt, L., Swenson, L. and Wilsson, E., 198244ya. “Mentalbeskrivning av valpar. Battre Tjanstehundar, Projektrapport II”. Statens Hundskola, Sveriges Lantbruksuniversitet and Stockholms Universitet. Unpublished.] The traits studied in 8-week-old German Shepherd puppies included: yelp (time from first separation from litter to first distress call); shriek (time from the same separation to the first serious, emphatic distress call); contact 1 (tendency to approach a strange person in a strange place after separation); fetch (pursue a ball and pick it up in the mouth); retrieve (bringing the ball back after picking it up); 389 reaction (to a strange object in a strange place); social competition (actually a form of tug-of-war); activity (number of squares entered when left in a marked arena); contact 2 (time spent near a strange person sitting passively in a chair in the middle of the marked arena); exploratory behavior (number of visits to strange objects placed in the corners of the marked arena). Estimates of heritabilities for the traits, calculated from sire components and dam components separately, are listed in Table XIII (Falt et al 198244ya). Although some specific behaviors had low heritability estimates, others had quite high estimates.
Table 13: Heritability estimates for Swedish German Shepherds (after Felt et al 198244ya)
Trait
Sire
Dam
Yelp
0.66
0.73
Shriek
0.22
0.71
Contact 1
0.77
1.01
Fetch
0.73
0.10
Retrieve
0.19
0.51
Reaction
0.09
1.06
Social competition
0.11
0.76
Activity
0.43
0.76
Contact 2
0.05
1.11
Exploratory behavior
0.31
0.83
…They felt that improved training and upbringing were as important as genetics in producing good behavior. Since the first-generation hybrids performed better than either of their pure-bred parents in problem-solving situations, Scott and Fuller recommended that cross-breds be considered as working dogs, provided that the pure-bred lines were properly maintained. Maintenance of the pure-bred lines seems important since they stated that the heterosis (hybrid vigor) lasted only for one generation. Consequently, inter-breeding of the hybrids should not result in any improvement in problem-solving ability. They also recommended against breeding one champion sire to many bitches, since they felt that good breeding programs need to consider multiple criteria to be effective (Scott & Fuller 196561ya).
Further reading:
Willis 199531ya, “Genetic aspects of dog behavior with particular reference to working ability”
Houpt & Willis 200125ya, “Genetics of behavior”
Takeuchi & Houpt 200323ya, “Behavior genetics”
Houpt 200719ya, “Review article genetics of canine behavior”
Hall & Wynne 201214ya, “The canid genome: behavioral geneticists’ best friend?”
Jones & Gosling 200521ya, “Temperament and personality in dogs (Canis familiaris): a review and evaluation of past research”
van den Berg et al 200323ya, “Behavior genetics of canine aggression: behavioral phenotyping of golden retrievers by means of an aggression test”
Van den Berg et al 200620ya, “Phenotyping of aggressive behavior in golden retriever dogs with a questionnaire”
Liinamo et al 200719ya, “Genetic variation in aggression-related traits in golden retriever dogs”
Lequarré et al 201115ya, “LUPA: a European initiative taking advantage of the canine genome architecture for unravelling complex disorders in both human and dogs”
Wilsson & Sundgren 199729ya, “The use of a behavior test for selection of dogs for service and breeding. II. Heritability for tested parameters and effect of selection based on service dog characteristics”
NBA Screening Scenario
Analogous to the dog cloning scenario, I consider the case of selecting for extremes on PGSes, motivated by a scenario of scouting tall men for the NBA.
Setting up the NBA selection problem as a liability threshold model with current height PGSes as a noisy predictor, height selection can be modeled as selecting for extremes on a PGS which is regressed back to the mean to yield expected adult height, and probability of being tall enough to consider a NBA career.
Filling in reasonable values, nontrivial numbers of tall people can be found by genomic screening with a current PGS, and as PGSes approach their predictive upper bound (derived from whole-genome-based heritability estimates of height), selection is capable of selecting almost all tall people by taking the top PGS percentile.
The selection problem above is fairly generic. The topic of ranking & selection based on a noisy predictor can be illustrated by considering a similar scenario.
Genomic Prediction of Height
Can height be predicted? Yes: one of the best-performing PGSes for a common human complex traits as of 2019 is height PGSes, which has leapt from ~20% in 2014 to predicting ~40–42% of variance or r = 0.65 in 2018 (Qian et al 2019/Lello et al 2017/Marquez-Luna et al 2018). Nor have current height PGSes have not hit a ceiling yet. Whole genome data indicates (Wainschtein et al 2019), using GCTA-like heritability techniques, that the pedigree-based heritability estimates of height are substantially correct and that whole genome sequencing will enable GWASes to eventually predict up to 79% variance or r = 0.89 for height.21
Can extreme height be predicted? Also yes—while the extremes of human height can be caused by diseases, and can be affected by rare mutations, particularly for shortness, for the most part, it and tallness in particular are caused by common genetic variants and thus extremely tall people have elevated height PGS scores (Chan et al 2011, Liu et al 2013, Sexton et al 2018; the last provides the specific case of Shawn Bradley, who is +4.2SD on the 201412ya height PGS). So, one can predict with considerable probability individuals of extreme height by looking for sufficiently extreme height PGSes.
Can extreme height of everyone be predicted? Yes, because eventually, everyone will be genetically sequenced. 23andMe and UK BioBank and Japan Biobank and All Of Us are only the start. The cost of SNP genotyping as of 2019 is far too low to not, as it would cost perhaps $25.52$202019 in bulk (about what the UKBB paid years ago), and it is profitable considering only pharmacogenomics (Verbelen et al 2016, Chanfreau-Coffinier et al 2019) and treatment of rare monogenic diseases (only partially solved by the universal use of heel prick tests22) and screening newborns (McRae et al 2017, Farnaes et al 2018, Ceyhan-Birsoy et al 2019, Sharp et al 2019), never mind the benefits to research (which will drive further progress & make it even more cost-effective through experience curve effects and better PGSes) or lifelong uses such as CAD/T2D/IBD/breast cancer/stroke (Torkamani et al 2019, Khera et al 2018, Inouye et al 2018, Mavaddat 2019, Abraham et al 2019, Mars et al 2019, Bolli et al 2019, Aguilera et al 2020) prediction & prevention. So height will be predictable for everyone (including the deceased).
Height in NBA Basketball
I’ll check up on anyone over 7 feet that’s breathing.
Ryan Blake, NBA scout23
Height is a guinea pig of human genetics because it is so visible, easily measured, highly heritable, and yet not a simple Mendelian trait but highly polygenic. Height is also interesting because a major professional sport, basketball, depends on the specific trait of height to an unusual extent–no other major sport (like soccer, baseball, football, or cricket) depends on a single physical highly-heritable highly-predictable trait the way basketball does. NBA players as of 2018 average 6 foot 7 inch (2.01 m), after a historical growth spurt which saw player heights grow enormously (stagnating in the past 2 decades, perhaps because they ran out of tall people and have had to emphasize athleticism & speed more than big men—although taller players are still paid more, and very tall youngsters like the 6 foot 9 inch Jalen Lewis now go pro as young as 16). The shortest player in the entire NBA as of 2018 is Isaiah Thomas at 5 foot 9 inch (1.75 m), and the shortest player ever was Muggsy Bogues, 5 foot 3 inch (1980s–1990s). (Graphing the current distribution of NBA player heights, it is fairly normal looking, but appears truncated at 6 foot and a bit right-skewed.) Amusingly, many NBA players are related, leading to speculation that LeBron James might play on a team with his own son—either of them (Bronny or Bryce).
The importance of height to NBA entrance is demonstrated by the extreme rarity of NBA-like height. The US adult male population has a mean height of 69.2 (2.98SD) inches24, while NBA players are almost a foot higher at a mean height of 79 inches, putting the average NBA player at fully +3.29SD in height25. There are perhaps <80,000 men in the USA >=3.29SD. (Sports journalist Pablo S. Torre has famously argued that “while the probability of, say, an American between 6’6” and 6’8” being an NBA player today stands at a mere 0.07%, it’s a staggering 17% for someone 7 feet or taller.”) And there were 3,853,472 babies total born in the USA in 2018 or ~1926736 male babies, so similarly, there are perhaps ~1000 male babies each year who will grow up to be >=3.29SD or the top 0.05% in height26, and perhaps ~25 with a PGS as extreme as Shawn Bradley27. Somewhat more realistic would be to ask what threshold a mean of +3.29 is; by the truncated normal28, that’s a threshold of +3.01SD or the top 0.13%, implying more like 2500 male babies per year, still a fairly small number.
Height As Screening Problem
A NBA or college basketball recruiter might be quite interested in knowing who those 2500 are—height is certainly not the only determinant of success, one has to at least want to play, but such a height would be a huge help in becoming a NBA player. Getting to potential recruits as early as possible could help develop an interest in basketball, accelerate their career, deal with rough patches, or just make them more attached to a particular college or team.
Regardless of how plausible this particular scenario is, is it at least statistically possible? Can extremes in adult height, given the base rates & the <100% heritability of height & r = 0.65 PGS, be predicted accurately enough to be plausibly useful for screening?
So conceptually the model is: a large sample of normal variables are generated (the PGS), then the top n% are selected; this creates a new distribution of truncated normal variables with a much higher mean, yielding a certain boost in SD (like +4SD), but then to predict the correlated variable (adult height), it must then be regressed back to the mean due to the r < 1 correlation of the 2 variables (error in the PGS), yielding a smaller outcome boost on the correlated variable (like +2SD); with the correct boost estimated, the probability any of the top n% will pass an additional threshold (eg. NBA height thresholds at +3.01SD) can then be calculated. (Trickily, the distribution of samples after selection is not merely a normal distribution shifted higher, but also has a different, smaller, SD, so that must be adjusted for as well as the higher mean.)
With the probability of success conditional on selecting the top n% with a PGS estimated, the total number of successful selected candidates be inferred from the total population and compared with the estimated number of all successful candidates to give an idea of screening efficiency.
The dog cloning approach can be partially reused here: the ‘heritability’ is 0.42 (variance of PGS with adult height), the global success rate is set by +3.01SD, and we want to know what pre-screening must be applied for a reasonable probability of a candidate succeeding. A reasonable value here might be 10%: a recruiter isn’t investing that much time in each possible recruit, but at 1% they’d be wasting a lot of their time, but 10% seems like a reasonable value to look at.
Model
Implementing the necessary truncated normal apparatus (exact implementation & a Monte Carlo implementation to check):
## can check with Monte Carlo and against `etruncnorm` & `vtruncnorm` in
## 'truncnorm' package: https://cran.r-project.org/web/packages/truncnorm/truncnorm.pdf
truncNormMean <- function(a, mu=0, sigma=1, b=Inf) {
        phi <- dnorm
        erf <- function(x) 2 * pnorm(x * sqrt(2)) - 1
        Phi <- function(x) { 0.5 * (1 + erf(x/sqrt(2))) }
        Z <- function(beta, alpha) { Phi(beta) - Phi(alpha) }

        alpha = (a-mu)/sigma; beta = (b-mu)/sigma

        return( (phi(alpha) - phi(beta)) / Z(beta, alpha) ) }
truncNormMeanMC <- function(a, mu=0, sigma=1, b=Inf, iters=1000000) {
    mean(Filter(function(x){x>a && x<b}, rnorm(iters, mean=mu, sd=sigma))) }

truncNormMean(1)
# [1] 1.52513528
truncNormMeanMC(1)
# [1] 1.52510301
library(truncnorm)
etruncnorm(1)
# [1] 1.52513528

truncNormSD <- function(a, mu=0, sigma=1, b=Inf) {
        phi <- dnorm
        erf <- function(x) 2 * pnorm(x * sqrt(2)) - 1
        Phi <- function(x) { 0.5 * (1 + erf(x/sqrt(2))) }
        Z <- function(beta, alpha) { Phi(beta) - Phi(alpha) }

       alpha = (a-mu)/sigma; beta = (b-mu)/sigma

       sqrt(1 +
           ((alpha * phi(alpha)) - phi(beta))/Z(beta,alpha) -
               (((phi(alpha)-phi(beta))/Z(beta,alpha))^2))
}
truncNormSDMC <- function(a, mu=0, sigma=1, b=Inf, iters=1000000) {
    sd(Filter(function(x){ x>=a & x <=b },  rnorm(iters, mean=mu, sd=sigma))) }

truncNormSD(1)
# [1] 0.446203614
truncNormSDMC(1)
# [1] 0.445727302
sqrt(vtruncnorm(a=1))
# [1] 0.446203614
Model the selection problem:
doubleSelection <- function(successP=0.01, preThreshold=0.01, heritability=0.42, verbose=FALSE) {
    r <- sqrt(heritability)
    threshold <- qnorm(1-preThreshold)

    meanPost <- truncNormMean(threshold) * r
    sdPost <- sqrt(truncNormSD(threshold))

    successThreshold <- qnorm(1-successP)

    p <- pnorm(meanPost - successThreshold, sd=sdPost)

    if (verbose) { print(c(r, threshold, meanPost, sdPost, successThreshold, p)) }
    p
    }
doubleSelectionMC <- function(successP=0.01, preThreshold=0.01, heritability=0.42,
                              iters=100000000, verbose=FALSE) {

    threshold <- qnorm(1-preThreshold)
    successThreshold <- qnorm(1-successP)
    r <- sqrt(heritability)

    library(MASS)
    data = mvrnorm(n=iters, mu=c(0, 0), Sigma=matrix(c(1, r, r, 1), nrow=2))

    screen     <- data[data[,1] >= threshold,]
    successful <- screen[screen[,2] >= successThreshold,]

    p <- nrow(successful) / nrow(screen)

    ## Skim to visualize non-normal post-selection distributions:
    if (verbose) { library(skimr);
        print(skim(screen[,1])); print(skim(screen[,2]))
        print(skim(successful[,2])); }
    p
}

doubleSelection(successP=(1-pnorm(3.01)), preThreshold=0.001, heritability=0.79, verbose=TRUE)
# [1] 0.888819442 3.090232306 2.992735123 0.510269172 3.010000000 0.486504425
# [1] 0.486504425
doubleSelectionMC(successP=(1-pnorm(3.01)), preThreshold=0.001, heritability=0.79, verbose=TRUE)
#     variable missing complete      n mean   sd   p0  p25  p50  p75 p100     hist
#  screen[, 1]       0   100076 100076 3.37 0.26 3.09 3.17 3.29 3.48 5.57 ▇▃▁▁▁▁▁▁
#  screen[, 2]       0   100076 100076 2.99 0.52 0.85 2.64 2.98 3.33  5.7 ▁▁▅▇▅▁▁▁
#  successful[, 2]       0    47745 47745 3.42 0.32 3.01 3.17 3.35 3.6  5.7 ▇▅▂▁▁▁▁▁
# [1] 0.477087414
Also of interest is calculating how many successful tall adults will be found in the screen, by applying the pre-selection & post-selection probability to the total sample:
net <- function(pre, h2) {
    p <- doubleSelection(successP=(1-pnorm(3.01)), preThreshold=pre, heritability=h2)
    population <- 1926736
    selected   <- population * pre
    successful <- selected * p
    print(round(digits=4, p)); print(round(c(selected, successful)))
    return(c(p, successful)) }

## Example: with the top 1%, we will get ~207 tall adults (out of the 2500):
net(0.01, 0.42)
# [1] 0.0107
# [1] 19267   207

## The tradeoff between spreading a wide net and catching as many as possible: as we spread a wider net,
## we catch more total, but each becomes much less likely to succeed. eg. AUC/ROC curves
round(digits=3, sapply(1/seq(from=1, to=100000, by=1000), function(pre) { net(pre, 0.42)}[1]))
#   [1]   NaN 0.052 0.079 0.098 0.114 0.127 0.139 0.150 0.159 0.168 0.176 0.184 0.191 0.197 0.203 0.209 0.215 0.220 0.226 0.231 0.235 0.240 0.244 0.248 0.252 0.256
#  [27] 0.260 0.264 0.268 0.271 0.274 0.278 0.281 0.284 0.287 0.290 0.293 0.296 0.299 0.301 0.304 0.307 0.309 0.312 0.314 0.317 0.319 0.321 0.324 0.326 0.328 0.330
#  [53] 0.332 0.334 0.336 0.338 0.340 0.342 0.344 0.346 0.348 0.350 0.352 0.353 0.355 0.357 0.359 0.360 0.362 0.364 0.365 0.367 0.368 0.370 0.372 0.373 0.375 0.376
#  [79] 0.378 0.379 0.381 0.382 0.383 0.385 0.386 0.387 0.389 0.390 0.391 0.393 0.394 0.395 0.397 0.398 0.399 0.400 0.402 0.403 0.404 0.405
round(sapply(1/seq(from=1, to=100000, by=1000), function(pre) { net(pre, 0.42)}[2]))
#   [1] NaN 101  76  63  55  49  45  41  38  36  34  32  31  29  28  27  26  25  24  23  23  22  21  21  20  20  19  19  18  18  18  17  17  17  16  16  16  15  15  15
#  [41]  15  14  14  14  14  14  13  13  13  13  13  12  12  12  12  12  12  12  11  11  11  11  11  11  11  11  10  10  10  10  10  10  10  10  10  10   9   9   9   9
#  [81]   9   9   9   9   9   9   9   9   9   9   8   8   8   8   8   8   8   8   8   8
Scenarios
It turns out that examining the top 0.3% (n = 600) by PGS2018 is enough to enrich candidates to a 10% probability of being tall enough for the NBA; combined, that implies ~60 tall people per year, and broadening to n = 10,000 will select ~3x more, 175 tall people:
net(0.0003, 0.42)
# [1] 0.1036
# [1] 578  60

net(10000 / 1926736, 0.42)
# [1] 0.0175
# [1] 10000   175
Screening 10,000 people is not unrealistic, and a payoff of 175 tall people is a potentially worthwhile one.
Considering potential further improvements, as the PGS approaches the WGS upper bound of 79%, with the top 0.3%, the yield boosts to ~408:
net(0.0003, 0.79)
# [1] 0.7064
# [1] 578 408
With such a predictor, one might want to cast a wider net; going back to a 10% success probability, with the optimal predictor, one would be able to recover essentially all tall people per year by taking the top 1.3% (n = 25,000):
net(0.013, 0.79)
# [1] 0.1008
# [1] 25048 2525
(At that point, uncaught tall people would be the exceptional cases: those not included in the screen to begin with, those who are tall because of diseases/environmental factors, those with novel de novo mutations not previously identified, etc.)
If a selection sample of n = 25,000 is too large despite being comprehensive, a sample 10x smaller (n = 2,500) will still recover about half the tall people by taking the top 0.13%:
net(2500 / 1926736, 0.79)
# [1] 0.4367
# [1] 2500 1092
In 201511ya, plans were announced for a Tianjin cloning center aiming for 100,000 clones a year—while its present status is unclear and as of 2017 it “seems to be well behind schedule”, it shows the ambitions.↩︎
For example, in apple breeding, there are so many seedlings and so few apple tasters, and the goal is to select apples so superior that they can potentially compete with existing commercial varieties (which have been selected out of countless millions of apple trees, on net, over the past few centuries), that the initial screening is a single bite of a single apple (which “happen to catch the eye”) from a single seedling for several years in a row with no second chances—and only then can the real testing begin.↩︎
The new bottleneck presumably becomes the human trainers, but they can give more intensive training or participate in research programs in peacetime to keep their skills sharp & train the next generation of human trainers, and given the popularity of ‘Schutzhund’ and ‘executive protection dogs’ among civilians, there may be enough civilian demand for trained dogs to maintain a reserve of trainers. This is probably a moot point for the USA, as the global ‘War on Terror’ and demand for SF dogs shows little sign of slackening soon.↩︎
“‘We made 49 because we were curious about the smallness’, explains Jeong, the head researcher. ‘Would it transfer?’ He shakes his head. ‘It didn’t—the clones turned out bigger.’” The owner sued H Bion/Sooam in March 2019, claiming that only 10 clones were supposed to be made and she has accused them of lying about the results to reuse them in micro-pigs and other projects without royalties (case 2019cv00425; complaint).↩︎
Choi et al 201313ya:
↩︎Six cloned dogs that finished the training course were evaluated by a final drug-detection dog selection test and all of them passed. The pass level was a score of 60. [The cloned dog] To-Tue was graded as Excellent (score 90) and the remaining five dogs were evaluated as Good. In age matched-controls, seven puppies finished the training course and one of them passed the test. One of the eight puppies died before the training course was over. The pass rate of cloned dogs was 86% since six puppies passed among seven cloned ones. That of controls was 13% in the aggregate since one passed among eight control ones. This value was lower than generally found as 30% (Maejima et al 2007) or 50% (Weiss and Greenberg 1997).
Interestingly, there was a previous successful cloned dog, in 200026ya, by the Missyplicity project (funded by a donation to Texas A&M University of $5,126,519.4$2,300,0001998)—but it was stillborn and not widely reported.↩︎
The citations are to interviews Frost conducted & summarized:
↩︎Andersen, Gary, LTC. Telephone interview, 1969-11-28. LTC Andersen stated that the rejection rate at procurement of MWDs is approximately 50%, due to medical problems (primarily hip dysplasia). The washout rate for a patrol dog is about 16%. He also mentioned that this rate used to be 5% in the 70’s. He did not know why the rejection rates were higher today, since the quality of the dogs is better. He said that it could be that not enough time is spent trying to get the ‘slower’ dogs to pass the training course (Frost, Parks). He said he felt the high rejection rate was one reason for the large backlog of requisitions. He also said there are adequate numbers of trainers, but there is no apparent formalized certification process. When asked about command and control of the MWD Program, LTC Andersen said he understood it, but it was very confusing to people outside the program, and that it is largely ineffective in function since there is no one central manager for all facets of the MWD Program (Burwell, Parks, Stamp).
Craig, Dan. Telephone interview, 1989-12-05. Dr. Craig said that all dogs procured for the MWD Program are bought for detector dogs, and those that wash out are trained as patrol dogs…He said that the rejection rate for Patrol/Explosive Dogs is 43%, while that for Patrol/Drug Dogs is 29% (Andersen; Burwell; McCathern, Telephone interview; Taylor, E.).
McCathern, Marge. Telephone interview, 1989-12-01. While discussing rejection rates in the MWD Program, Ms. McCathern said the rejection rate for the new explosive course was 83%, and that it differs for each course. She also said the rejection rate at procurement was around 50%. She advised the author to talk to Dr. Craig for the average costs involved in training each specialty of MWD.
Thorton, William H., LTC. “The Role of Military Working Dogs in Low Intensity Conflict”. Army-Air Force Center for Low Intensity Conflict. This paper discusses the historical and current roles of the MWD, and presents reasoning for the need to expand the role of the MWD. Such reasoning centers around economy of force, low technology, high capability, operational flexibility of the MWD, and the need for wider use of the MWDs capabilities other than as a law enforcement asset. Problems with the current MWD system are presented. The paper states that 98% of all dogs procured by DODDC come from Europe, that 45% are rejected after training, and that there is a backlog of 430 requisitions of MWDs (Taylor, E.).
The citations from Sinn et al 201016ya:
Wilsson & Sundgren 199729yab, “The use of a behavior test for the selection of dogs for service and breeding. I: Method of testing and evaluating test results in the adult dog, demands on different kinds of service dogs, sex and breed differences”:
All dogs that did not fulfil the demands of a service dog were disqualified and were sold as companion animals or donated to the puppy walkers who had previously had cared for them. About 50% of the dogs selected for training were disqualified during the training period. After completion of the training program all dogs were finally run through a battery of working tests performed by the buyer of the dogs (the police force, guide dog association). In this work only the dogs that passed this final test are referred to as service dogs.
Slabbert & Odendaal 199927ya, “Early prediction of adult police dog efficiency—a longitudinal study”:
Up to 70% of dogs that were bred at the South African Police Service Dog Breeding Center (SAPSDBC) were not suitable for use.
Maejima et al 200719ya, “Traits and genotypes may predict the successful training of drug detection dogs”:
In Japan, approximately 30% of dogs that enter training programs to become drug detection dogs successfully complete training.
Trident K9 Warriors, Ritland & Brozek 201313ya:
↩︎…As rare as it is to find a dog with the kind of prey drive that we seek, it is equally difficult to find a dog with the kind of nose that will help it succeed as a working dog with the SEAL Teams. Finding a dog with both those qualities is truly a one-in-a-thousand (or more) proposition. That’s where good breeding comes in, of course, and selecting for both those traits will invariably produce dogs that are stronger in one area over another…The last quality that I look for is difficult to describe in delicate terms. A dog has to have a big set of nuts on him—metaphorically speaking. Most dogs, even among those selected from the elite breeders from around the world, don’t have the kind of dominance and true forward aggression that is needed. Dogs have been domesticated and bred for so long that the type of dog that is willing to stand up to and fight a human—a human that is not frightened by that dog and physically capable of disabling that dog—is a very, very rare animal. I call them the 1 percenters (this was before the term had a political connotation), but they are more like one in ten thousand.
…It is also important to understand that when I acquire a dog from a breeder of Malinois, I’m not getting a very young puppy who hasn’t been trained at all. The two-to-three-year-old dogs have already gone through rigorous training; some even have become what is referred to as a “titled dog.” That means that they’ve been trained and have earned a certification in one of several different European dog sports. One of the more common types of those is Schutzhund, a dog sport popular in Germany. When this sport was first organized and the competitions formalized, a dog that had completed Schutzhund training and became certified in the sport was also essentially qualified to be a German police dog. That was the original intent of the program, but between politics and hurt feelings, the dogs that earn the “title” don’t necessarily have the competency to become actual working police dogs. The sport is so popular that other breeds of dogs now can enter into the competitions.
…Again, that comparison between the human members of the SEAL Teams and their canine co-workers applies. No one goes into the SEAL Teams without first completing basic training and then one additional level before starting BUD/S training. While there is a 75% attrition rate among those entering BUD/S, we don’t have that great a failure rate among the dogs. I haven’t kept statistics to track that rate among the dogs we acquire, but it is more like three or four in ten instead of seven and a half out of ten.
Part of the reason for that is that the early weeding-out process among the dogs is more vigorous than it is among the sailors. As I stated earlier, I felt the first test I had to pass to qualify as a SEAL Team candidate wasn’t very hard at all. When I’m evaluating prospective team dogs, my standards are much higher. In addition, when we select sires and bitches for breeding, we already have in mind the kinds of work that these dogs will be asked to do. As a consequence, we breed for those qualities, and from the moment those dogs are born—to be more precise, in the first several days of their lives—I’m already beginning their training.
“‘They’ve been performing excellent. They’re exactly like the original one’, he said in a telephone interview. ‘I can say it absolutely does work, and we have been able to create the same dog with the same qualities.’…Brannon, who also trains dogs for police departments around the U.S. as well as the military, said he was skeptical about cloning in the beginning but is now convinced it is more efficient than natural-breeding programs. He’s expecting another clone next year—this one the twin of a dog that has helped agents find millions of dollars in narcotics and apprehend many suspects.”↩︎
MacLean et al 2019:
↩︎We assessed the heritability(h2) of 14 behavioral traits (Fig 1) measured by the Canine Behavioral Assessment and Research Questionnaire (C-BARQ), a well-validated instrument for quantifying diverse aspects of dog behavior (17, 18, 19, 20), including aggression, fear, trainability, attachment, and predatory chasing behaviors. We combined behavioral data from 14,020 individual dogs with breed-level genetic identity-by-state (IBS) estimates…Using a mixed-effects modeling approach (Efficient Mixed-Model Association; EMMA) to control for relatedness between breeds, we found that a large proportion of variance in dog behavior is attributable to genetic factors (Fig 1). The mean heritability was 0.51 ± 0.12 (SD) across all 14 traits (range: h2 0.27–0.77), and significantly higher than the null expectation in all cases (permutation tests, p < 0.001).
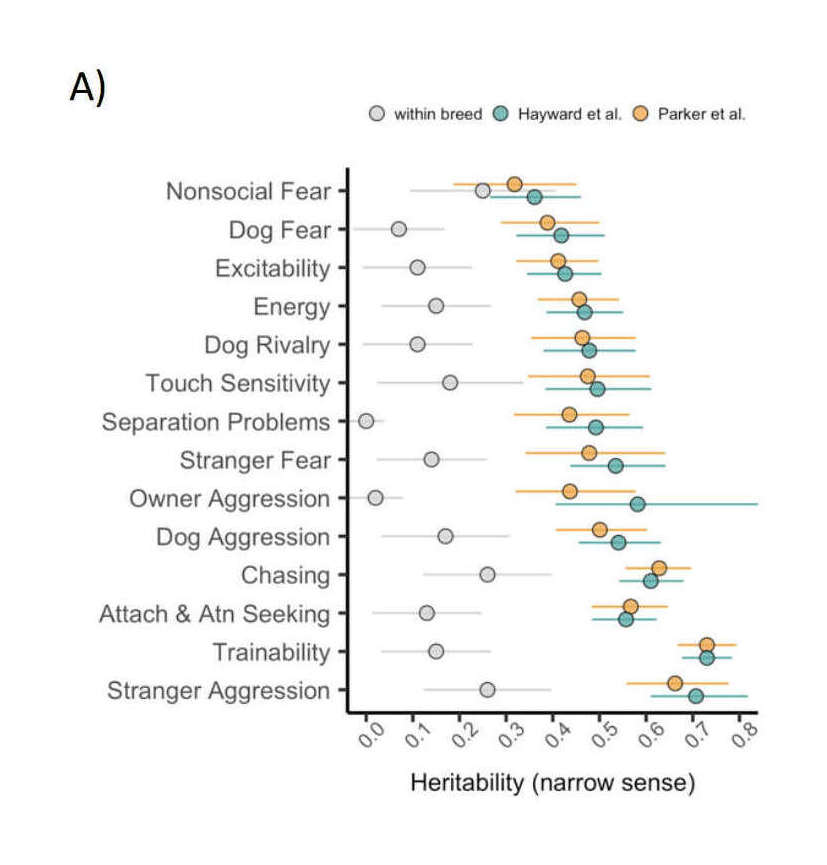
Figure 1: Heritability estimates, breed-level behavioral data, and clustering based on behavioral and genetic data. (A) Heritability (h2) estimates (proportion of variance attributable to genetic factors) for 14 behavioral traits. Genotypic variation accounts for five times more variance in analyses across versus within breeds (within-breed estimates compiled from Ilska et al 2017). Points for Hayward et al and Parker et al reflect the results of analyses with independent genetic datasets. Error bars reflect the 95% confidence intervals.
These estimates are also substantially higher than those identified in previous studies assessing heritability of these traits in large within-breed samples (t13 = −12.25, p < 0.001; 22, but see 23). Estimating between-breed variance thus yields h2 estimates that are on average, five times higher (range= 1.3–25.5 times higher), which is likely due to more variance among, compared to within breeds. Interestingly, the traits with the highest heritability were trainability (h2 = 0.73), stranger-directed aggression (h2 = 0.68), chasing (h2 = 0.62) and attachment and attention seeking (h2 = 0.56), which is consistent with the hypothesis that these behaviors have been important targets of selection during the cultivation of modern breeds.
Shockley 1957 provides an analogous example: scientific productivity.
If SF dogs are similar, then there could be dogs which are orders of magnitude better than others, and this could stem from small advantages over competitors at each step; so small heritabilities producing small gains could still produce large output gains as long as many steps are being improved simultaneously.↩︎
Choi 2018 doesn’t seem to be using the same dataset as Choi et al 201412ya, because in Choi et al 201412ya, there were 8 clones and in Choi 2018 there were 6 clones; and in the latter, 3⁄4 control puppies passed quarantine training.↩︎
Numbers >500 often come up in Sooam/police articles, and the sniffer article specifies that it has 42 currently and that 50% were clones by 201412ya from the initial police clones somewhere ~2008; given substantial turnover in dogs with careers <10 years and an 80% success rate, that implies at least hundreds have entered sniffer training total.↩︎
-
“The DoD MWD Trainer/Supervisor Course provides kennel masters and trainers with the skills to enhance their MWD program. The course includes instruction in kennel management, administration, dog team training, and contemporary employment concepts” (Briefing by LTC Bannister the commander of the 341st Training Squadron, on September 7, 200521ya).
The DoD MWD Course [which produces the trained dogs] provides both patrol and dual certified patrol/detector dogs [Cost is about $84,890.1$50,0002005 per trained dog.] The course is 120-days long. The dogs are trained in either drug or explosive detection. The dogs are trained to detect marijuana, hashish, heroin, and cocaine and must meet a 90% accuracy standard to certify. Explosive detector dogs are trained to detect seven explosive substances (smokeless powder, nitro dynamite, ammonia dynamite, TNT, C-4, water gel, and det cord) and two chemical compounds (sodium and potassium chlorate) and must meet a strict 95% standard (briefing by LTC Bannister, commander of the 341st Training Squadron, on September 7, 200521ya).
The 341st is a major training location as of 2011:
↩︎With a second kennel facility located on Medina Annex about a mile away, Lackland AFB has approximately 900 dogs at any given time. The squadron’s school trains about 270 multipurpose dogs a year, according to school officials. Not only does the school train new dogs, but it trains handlers and supervisors as well… To keep up with the demand for trained dogs, the school uses a variety of procurement methods, including its own breeding program. The suitability rate runs around 50 percent. In other words, to produce 100 serviceable dogs per year, the program will attempt to train about 200.
Trident K9 Warriors, Ritland & Brozek 201313ya:
↩︎…No matter that the navy had invested more than $75,054.87$50,0002013 in the acquisition, training, and care of Duco before Seth spent that year in our program pre-deployment, Duco was still “his.” That was as it should be; unfortunately, it isn’t always. I’ve trained hundreds of dogs for a variety of purposes, and it’s not always easy to let them go to another home, especially a quality dog like Duco. Training dogs to be of service to us is my job, and it’s also my passion. Seeing how a pair like Seth and Duco continue to operate does my heart good.
-
↩︎The U.S. military spends up to $381,542.41$283,0002017 to train a working war dog.
Once it has a promising pup, the Pentagon spends an additional $56,624.67$42,0002017 to train a K9 unit, a process that starts with obedience and drug and/or bomb detection at Lackland Air Force Base in San Antonio, Texas. Some of the dogs get a second round of training in how to patrol, detain an enemy and attack. A “dual-purpose” dog spends about 120 days completing both training cycles.
When all is said and done, a fully trained military dog costs about as much as a small missile. Keeping them in the field as long as possible is increasingly good business. (The Air Force declined to discuss canine casualty rates.)
pg37, Dog, Inc.: The Uncanny Inside Story of Cloning Man’s Best Friend, Woestendiek 201016ya.↩︎
Perhaps by combining noisy ratings like training records & completed service records & handler ratings & general surveys, and selecting the best out of 10,000+ candidates; since there’s no available data for even speculating about what are plausible r values for such a procedure or what the total number of candidates might be if a government like the US federal government made a serious effort to screen all of its & available allies’ SF dogs, let’s consider ‘1 of 1000’ as something of a lower bound—there are surely tens of thousands of SF dogs available now & in decades to come, and a SF cloning program should be able to at least select from the top few hundred of those SF dogs. (Bloomberg 2017, of the US alone: “At the moment, roughly 1,600 Military War Dogs (MWDs) are either in the field or helping recuperating veterans.”; NYT 2011, 2700.)↩︎
The MC indicates that the exact implementation is slightly wrong, off by a relative −1%; I have not identified why the exact implementation is conservative, given that I have copied it from Lynch & Walsh 1998’s formulas as exactly as I could and I found no errors despite checking my code repeatedly, but it seems to be the variance of selected individuals being too small. My guess is that the original formula was derived under an assumption of constant population variance (which is in fact surprisingly accurate even for long-term breeding programs), and so it is a slight approximation not worth being concerned about. The result is simply that the numbers will be slightly biased against cloning efficacy.↩︎
Reaching such a predictor will be extremely difficult in the near-term, but it’s worth remembering that pedigree & GWAS are not mutually exclusive approaches, and predicting solely from SNPs is not the only nor the best possible way to do genomic prediction. GWASes can be extended to the mixed model approach, where genetic relatedness to other individuals of known phenotype is used for prediction. Explicitly modeling relatedness of individuals is a powerful method of prediction (if someone is more genetically similar to their tall paternal grandfather than their tall maternal grandmother, you can predict they will be taller without knowing any specific SNPs), and can be combined with PGS-based approaches based on individual SNPs. The BLUP framework, for example, is widely used in agriculture for much better predictions than possible with merely individual SNPs (Gianola & Rosa 2015; in GWAS, eg. Loh et al 2018, Truong et al 2020). Height is typically measured by biobanks, so as they get larger, use of SNP or WGS data for inferring genetic relatedness will become more feasible.↩︎
Which, incidentally, are often kept in storage and would allow overnight sequencing of a large fraction of the population. Every baby in California since 1983 has blood spots stored, which could be used for genome sequencing.↩︎
As quoted by Pablo S. Torre, 201115ya.↩︎
According to Table 12 of “Anthropometric Reference Data for Children and Adults: United States, 201115ya—2014”, so:
all races: 69.2 inches
95th percentile: 74.1 inches
95th percentile = +1.64 SD
(74.1 − 69.20) / 1.64
SD = 2.98
NBA mean of 6 foot 7 inches = 79 inches = (79 − 69.2) / 2.98 = +3.29SD.↩︎
(1-pnorm(3.29))*1926736↩︎1926736 * (1 - pnorm(4.2))↩︎truncNormMean(3.01) → 3.923↩︎