Zeo sleep self-experiments
EEG recordings of sleep and my experiments with things affecting sleep quality or durations: melatonin, potassium, vitamin D etc.
I discuss my beliefs about Quantified Self, and demonstrate with a series of single-subject design self-experiments using a Zeo. A Zeo records sleep via EEG; I have made many measurements and performed many experiments. This is what I have learned so far:
the Zeo headband is wearable long-term
melatonin improves my sleep
one-legged standing does little
Vitamin D at night damages my sleep & Vitamin D in morning does not affect my sleep
potassium (over the day but not so much the morning) damages my sleep and does not improve my mood/productivity
small quantities of alcohol appear to make little difference to my sleep quality
I may be better off changing my sleep timing by waking up somewhat earlier & going to bed somewhat earlier
lithium orotate does not affect my sleep
Redshift causes me to go to bed earlier
ZMA: inconclusive results slightly suggestive of benefits
Quantified Self (QS) is a movement with many faces and as many variations as participants, but the core of everything is this: experiment with things that can improve your life.
What Is QS?
Quantified Self is not expensive devices, or meet-ups, or videos, or even ebooks telling you what to do. Those are tools to an end. If reading this page does anything, my hope is to pass on to some readers the Quantified Self attitude: a playful thoughtful attitude, of wondering whether this thing affects that other thing and what implications could be easily tested. “Science” without the capital “S” or the belief that only scientists are allowed to think.
That’s all Quantified Self is, no matter how simple or complicated your devices, no matter how automated your data collection, no matter whether you found a pedometer lying around or hand-engineered your own EEG headset.
Quantified Self is simply about having ideas, gathering some data, seeing what it says, and improving one’s life based on the data. If gathering data is too hard and would make your life worse off—then don’t do it! If the data can’t make your life better—then don’t do it! Not every idea can or should be tested.
The QS cycle is straightforward and flexible:
Have an idea
Gather data
Test the data
Make a change; GOTO 1
Any of these steps can overlap: you may be collecting sleep data long before you have the idea (in the expectation that you will have an idea), or you may be making the change as part of the data in an experimental design, or you may inadvertently engage in a “natural experiment” before wondering what the effects were (perhaps the baby wakes you up on random nights and lets you infer the costs of poor sleep).
The point is not publishable scientific rigor. If you are the sort of person who wants to run such rigorous self-experiments, fantastic! The point is making your life better, for which scientific certainty is not necessary: imagine you are choosing between equally priced sleep pills and equal safety; the first sleep pill will make you go to sleep faster by 1 minute and has been validated in countless scientific trials, and while the second sleep pill has in the past week has ended the sweaty nightmares that have plagued you every few days since childhood but alas has only a few small trials in its favor—which would you choose? I would choose the second pill!
To put it in more economic/statistical terms, what we want from a self-experiment is for it to give us a confidence just good enough to tell whether the expected value of our idea is more than the idea will cost. But we don’t need more confidence unless we want to persuade other people! (So from this perspective, it is possible to do a QS self-experiment which is “too good”. Much like one can overpay for safety and buy too much insurance—like extra warranties on electronics such as video game consoles, a notorious rip-off.)
What QS Is Not: (Just) Data Gathering
One failure mode which is particularly dangerous for QSers is to overdo the data collection and collect masses of data they never use. Famous computer entrepreneur & mathematician Stephen Wolfram exemplified this for me in March 201214ya with his lengthy blog post “The Personal Analytics of My Life” in which he did some impressive graphing and exploration of data 1989–23201214ya: a third of a million (!) emails, full keyboard logging, calendar, phone call logs (with missed calls include), a pedometer, revision history of his tome A New Kind of Science, file types accessed per date, parsing scanned documents for dates, a treadmill, and perhaps more he didn’t mention.
Wolfram’s dataset is well-depicted in informative graphs, breathtaking in its thoroughness, and even more impressive for its duration. So why do I read his post with sorrow? I am sad for him because I have read the post several times, and as far as I can see, he has not benefited in any way from his data collection, with one minor exception:
Very early on, back in the 1990s, when I first analyzed my e-mail archive, I learned that a lot of e-mail threads at my company would, by a certain time of day, just resolve themselves. That was a useful thing to know, because if I jumped in too early I was just wasting my time.
Nothing else in his life was better 1989–23201214ya because he did all this, and he shows no indication that he will benefit in the future (besides having a very nifty blog post). And just reading through his post with a little imagination suggests plenty of experiments he could do:
He mentions that 7% of his keystrokes are the Backspace key.
This seems remarkably high—vastly higher than my own use of backspace—and must be slowing down his typing by a nontrivial amount. Why doesn’t he try a typing tutor to see if he can improve his typing skill, or learn the keyboard shortcuts in his text editor? If he is wasted >7% of all his typing (because he had to type what he is Backspacing over, of course), then he is wasting typing time, slowing things done, adding frustration to his computer interactions and worst, putting himself at greater risk of crippling RSI.
How often does he access old files? Since he records access to all files, he can ask whether all the logging is paying for itself.
Is there any connection between the steps his pedometer records and things like his mood or emailing? Exercise has been linked to many benefits, both physical and mental, but on the other hand, walking isn’t a very quick form of exercise. Which effect predominates? This could have the practical consequence of scheduling a daily walk just as he tries to make sure he can have dinner with his family.
Does a flurry of emails or phone calls disrupt his other forms of productivity that day? For example, while writing his book would he have been better off barricading himself in solitude or working on it in between other tasks?
His email counts are astonishingly high in general:
Is answering so many emails really necessary? Perhaps he has put too much emphasis on email communication, or perhaps this indicates he should delegate more—or if running Mathematica is so time-consuming, perhaps he should re-evaluate his life and ask whether that is what he truly wants to do now. I have no idea what the answer to any of these questions are or whether an experiment of any kind could be run on them, but these are key life decisions which could be prompted by the data—but weren’t.
Another QS piece(“It’s Hard to Stay Friends With a Digital Exercise Monitor”) struck me when the author, Jenna Wortham, reflected on her experience with her Nike+ FuelBand motion sensor:
The forgetfulness and guilt I experienced as my FuelBand honeymoon wore off is not uncommon, according to people who study behavioral science. The collected data is often interesting, but it is hard to analyze and use in a way that spurs change. “It doesn’t trigger you to do anything habitually,” said Michael Kim, who runs Kairos Labs, a Seattle-based company specializing in designing social software to influence behavior…Mr. Kim, whose résumé includes a stint as director of Xbox Live, the online gaming system created by Microsoft, said the game-like mechanisms of the Nike device and others like it were “not enough” for the average user. “Points and badges do not lead to behavior change,” he said.
Finally, Neal Stephenson, in discussing his treadmill desk use focuses on estimating mileage & caloric expenditure and showing the effects of bad posture he developed—but he entirely ignores issues of whether it affected his typing, his writing, or anything that might actually matter.
One thinks of a saying of W. Edwards Deming: “Experience by itself teaches nothing.” Indeed. A QS experiment is a 4-legged beast: if any leg is far too short or far too long, it can’t carry our burdens.
And with Wolfram and Wortham, we see that 2 legs of the poor beast have been amputated. They collected data, but they had no ideas and they made no changes in their life; and because QS was not part of their life, it soon left their life. Wortham seems to have dropped the approach entirely, and Wolfram may only persevere for as long as the data continues to be useful in demonstrating the abilities of his company’s products.
Zeo QS
On Christmas 201016ya, I received one of Zeo Inc’s (founded 200323ya, shutting down 2013) Zeo bedside unit after long coveting it and dreaming of using it for all sorts of sleep-related questions. (As of February 201313ya, the bedside unit seems to’ve been discontinued; the most comparable Zeo Inc. product seems to be the Zeo Sleep Manager Pro, ~$135.1$902013.) With it, I begin to apply my thoughts about Quantified Self.
A Zeo is a scaled-down (one-electrode) EEG sensor-headband, which happens to have an alarm clock attached. The EEG data is processed to estimate whether one is asleep and what stage of sleep one is in. Zeo breaks sleep down into waking, REM, light, and deep. (The phases aren’t necessarily that physiologically distinct.) It’s been compared with regular polysomnography by Zeo Inc and others1 and seems to be reasonably accurate. (Since regular sleep tests cost hundreds to thousands of dollars per session and are of questionable external validity since they are a different uncomfortable setting than your own bedroom, I am fine with a Zeo being just “reasonably” accurate in predicting PSG ratings.)
The data is much better than what you would get from more popular methods like cellphones with accelerometers, since an accelerometer only knows if you are moving or not, which isn’t a very reliable indicator of sleep2. (You could just be lying there staring at the ceiling, wide awake. Or perhaps the cat is kneading you while you are in light sleep.) As well, half the interest is how exactly sleep phases are arranged and how long the cycles are; you could use that information to devise a custom polyphasic schedule or just figure out a better nap length than the rule-of-thumb of 20 minutes. And the price isn’t too bad—$228.54$1502012 for the normal Zeo as of February 201214ya. (The basic mobile Zeo is much cheaper, but I’ve seen people complain about it and apparently it doesn’t collect the same data as more expensive mobile version or the original bedside unit.)
Tests
A thinker sees his own actions as experiments & questions—as attempts to find out something. Success and failure are for him answers above all.
I personally want the data for a few distinct purposes, but in the best Quantified Self vein, mostly experimenting:
more thoroughly quantifying the benefits of melatonin
and dose levels: 1.5mg may be too much. I should experiment with a variety: 0.1, 0.5, 1.0, 1.5, and 3mg?
quantifying the costs of modafinil
testing benefits of huperzine-A3
designing & starting polyphasic sleep
assisting lucid dreaming
reducing sleep time in general (better & less sleep)
investigating effects of n-backing:
do n-backing just before sleep, and see whether percentages shift (more deep sleep as the brain grows/changes?) or whether one sleeps better (fewer awakenings, less light sleep).
do n-backing after waking up, to look for correlation between good/bad sleeps and performance (one would expect good sleep → good scores).
test the costs of polyphasic sleep on memory4
(positive) effect of Seth Roberts’s one-legged standing on sleep depth/efficiency
possible sleep reductions due to meditation
serial cable uses:
quantifying meditation (eg. length of gamma frequencies)
rank music by distractibility?
measure focus over the day and during specific activities (eg. correlate frequencies against n-backing performance)
Measure negative effect of nicotine on sleep & determine appropriate buffer
test claims of sleep benefits from magnesium
I have tried to do my little self-experiments as well as I know how to, and hopefully my results are less bogus than the usual anecdotes one runs into online. What I would really like is for other people (especially Zeo owners) to replicate my results. To that end I have taken pains to describe my setups in complete detail so others can use it, and provided the data and complete R or Haskell programs used in analysis. If anyone replicates my results in any fashion, please contact me and I would be happy to link your self-experiment here!
First Impressions
First Night
Christmas morning, I unpacked it and admired the packaging, and then looked through the manual. The base-station/alarm-clock seems pretty sturdy and has a large clear screen. The headband seemed comfortable enough that it wouldn’t bother me. The various writings with it seemed rather fluffy and preppy, but I did my technical homework before hand, so could ignore their crap.
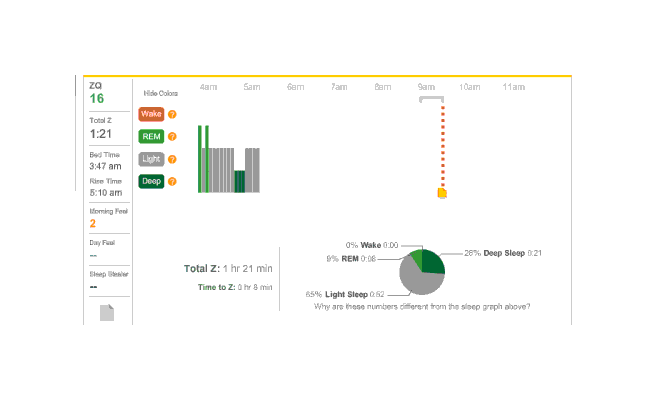
Late that night (quite late, since the girls stayed up playing Fable 3 and Xbox Kinect dancing games and what not), I turn in wearily. I had noticed that the alarm seemed to be set for ~3:30 AM, but I was very tired from the long day and taking my melatonin, and didn’t investigate further—I mean, what electronic would ship with the alarm both enabled and enabled for a bizarre time? It wasn’t worth bothering the other sleeper by turning on the light and messing with it. I put on the headband, verified that the Zeo seemed to be doing stuff, and turned in. Come 3 AM, and the damn music goes off! I hit snooze, too discombobulated to figure out how to turn off the alarm.
So that explains the strange Zeo data for the first day:
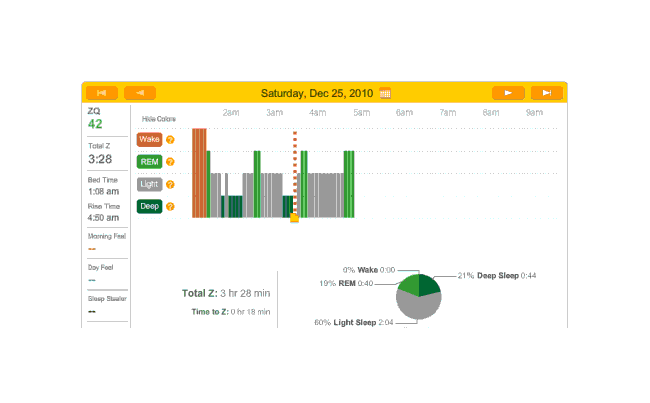
First night
The major surprise in this data was how quickly I fell asleep: 18 minutes. I had always thought that I took much longer to fall asleep, more like 45 minutes, and had budgeted accordingly; but apparently being deluded about when you are awake and asleep is common—which leads into an interesting philosophical point: if your memories disagree with the Zeo, who should you believe? The rest of the data seemed too messed up by the alarm to learn anything from.
Uses
Meditation
One possible application for Zeo was meditation. Most meditation studies are very small & methodologically weak, so it might be worthwhile to verify for oneself any interesting claims. If Zeo’s measuring via EEG, then presumably it’s learning something about how relaxed and activity-less one’s mind is. I’m not seeking enlightenment, just calmness, which would seem to be in the purview of an EEG signal. (As Charles Babbage said. errors made using insufficient data are still less than errors made using no data at all.) But alas, I meditated for a solid 25 minutes and the Zeo stubbornly read at the same wake level the entire time; I then read my Donald Keene book, Modern Japanese diaries, for a similar period with no change at all. It is possible that the 5-minute averaging (Zeo measures every 2 seconds) is hiding useful changes, but probably it’s simply not picking up any real differences. Oh well.
Smart Alarm
The second night I had set the alarm to a more reasonable time, and also enabled its smart alarm mode (“SmartWake”), where the alarm will go off up to 30 minutes early if you are ever detected to be awake or in light sleep (as opposed to REM or deep sleep). One thing I forgot to do was take my melatonin; I keep my supplements in the car and there was a howling blizzard outside. It didn’t bother me since I am not addicted to melatonin.
In the morning, the smart alarm mode seemed to work pretty well. I woke up early in a good mode, thought clearly and calmly about the situation—and went back to sleep. (It’s a holiday, after all.)
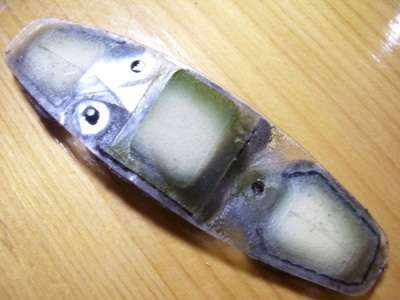
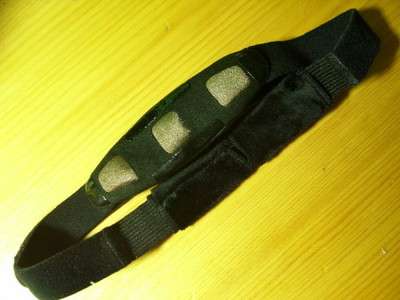
Replacing Headband
Around 2011-05-15, I gave up on the original headband—it was getting too dirty to get good readings—and decided to rip it apart to see what it was made of, and to order a new set of three for $54.34$352011 (which seems reasonable given the expensive material that the contacts are made of—silver fabric); they then cost $50. A little googling found me a coupon, FREESHIP, but apparently it only applied to the Zeo itself and so the pads were actually $62.1$402011, or ~$20.18$132011 a piece. I won’t say that buying replacement headbands semi-annually is something that thrills me, but $31.05$202011 a year for sleep data is a small sum. Certainly it’s more cost-effective than most of the nootropics I have used. (Full disclosure: 9 months after starting this page, Zeo offered me a free set of headbands. I used them and when the news broke about Zeo going out of business, I bought another set.)
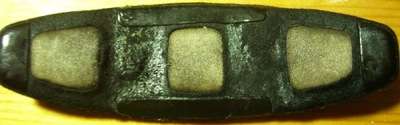
The old headband, with electrical tape residue
 /
/
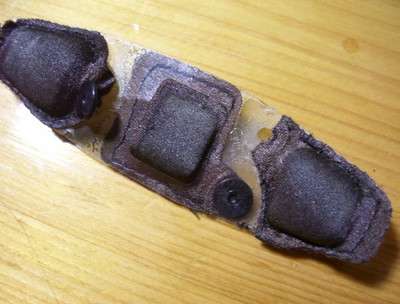
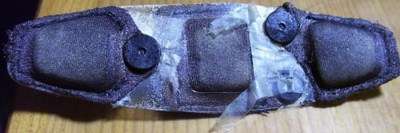
Said headband with plastic removed; notice discoloration of metal despite cleaning
 /
/

The new headband’s wrapper
 /
/
In the future, I might try to make my own; eok.gnah claims that buying the silver fabric is apparently cheaper than ordering from Zeo, marciot reports success in making headbands, and it seems one can even hook up other sensors to the headband. Another alternative is, since the Zeo headband is a one-electrode EEG headset, to take an approach similar to the EEG people and occasionally add small dabs of conductive paste, since fairly large quantities are cheap (eg. 12oz for $45.71$302012). There was a disposable adhesive gel ECG electrodes with offset press-stud connections being experimented with by Zeo Inc, but they never entered wide use before it shut down.
One problem with the sensor mounted on the headband is that the lithium battery inside it can stop holding a charge. The casing is extremely difficult to open without damaging the circuitry or connections, and the battery inside is soldered to the circuit board:
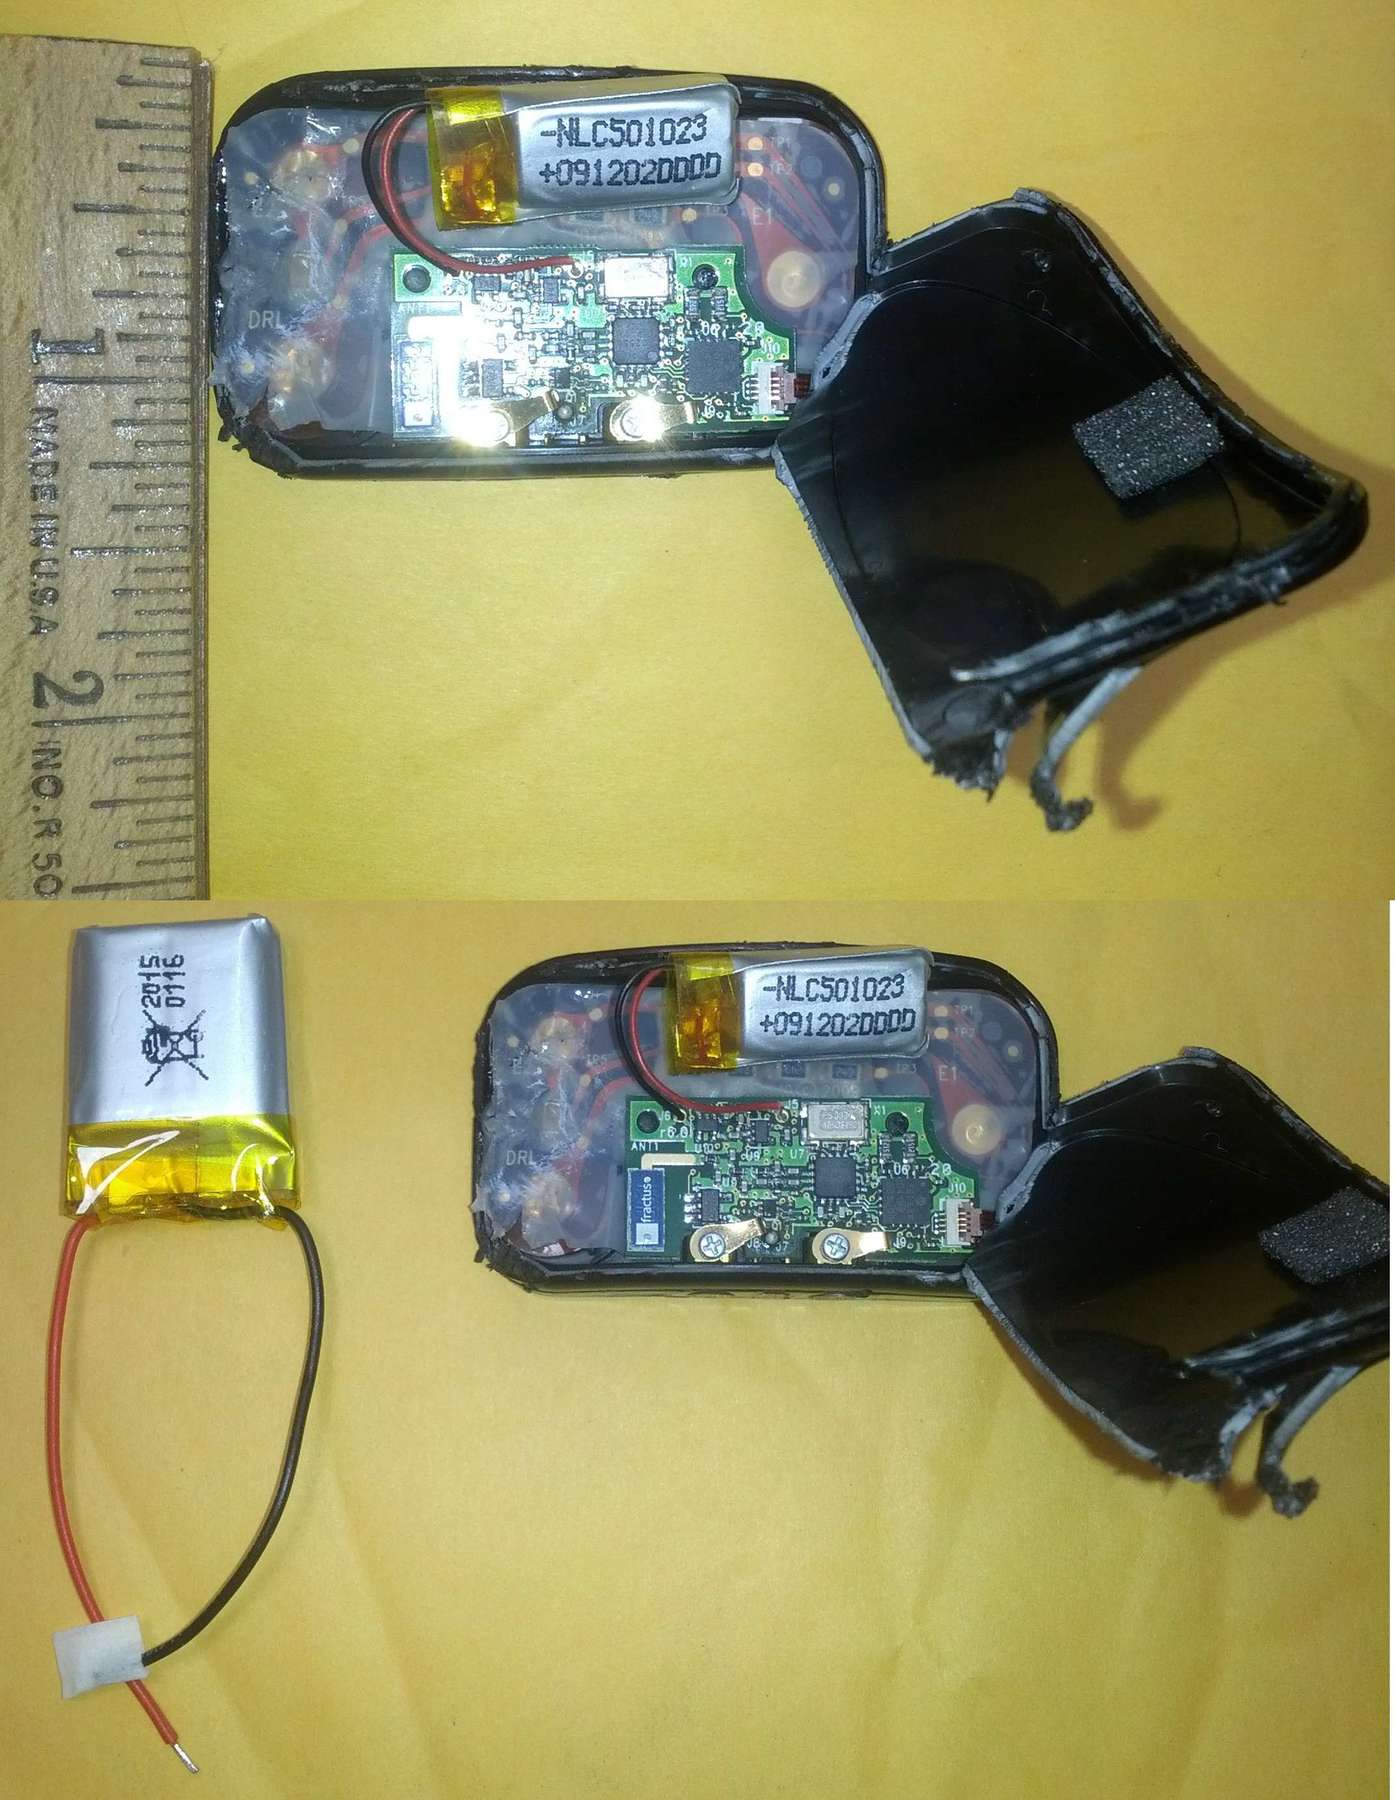
An opened Zeo headband sensor
Once safely opened, the battery can be replaced by another one of similar size. For details, see the Quantified Self forum thread.
Melatonin
Before writing my melatonin advocacy article, I had used melatonin regularly for 6+ years, ever since I discovered (somewhen in high school or college) that it was useful for enforcing bedtimes and seemed to improve sleep quality; when I posted my writeup to LessWrong people were naturally a little skeptical of my specific claim that it improved the quality of my sleep such that I could reduce scheduled time by an hour or so. Now that I had a Zeo, wouldn’t it be a good idea to see whether it did anything, lo these many years later?
The following section represents 5 or 6 months of data (raw CSV data; guide to Zeo CSV). My basic dosage was 1.5mg of melatonin taken 0-30 minutes before going to sleep.
Graphic
Deep sleep and ‘time in wake’ were both apparently unaffected; ‘time in wake’ apparently had too small a sample to draw much conclusion:
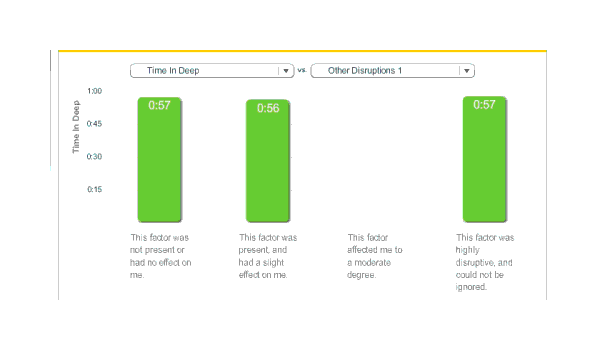
Melatonin, time in deep over five months,
Surprisingly, total REM sleep fell:
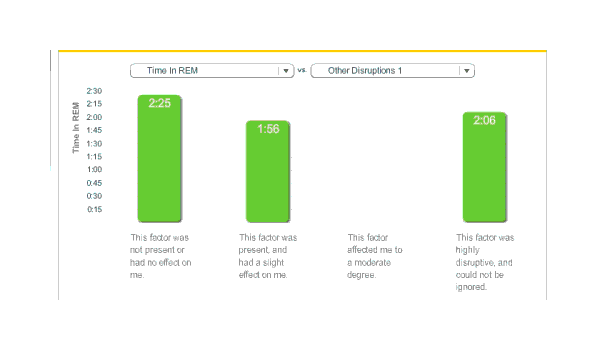
Melatonin, time in REM
While the raw ZQ falls, the regression takes into account the correlated variables and indicates that this is something of an
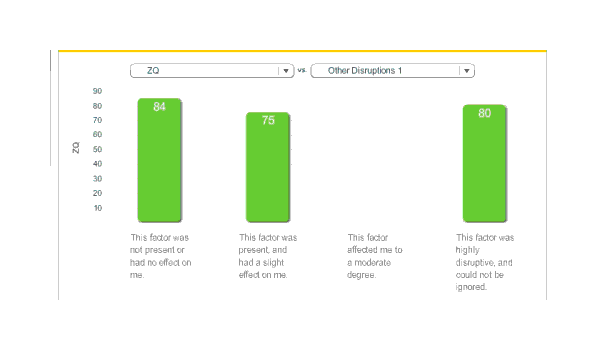
Melatonin, ZQ
REM’s average fell by 29 minutes, deep sleep fell by 1 minute, but total sleep fell by 54 minutes; this implies that light sleep fell by 24 minutes. (The averages were 254.2 & 233.3) I am not sure what to make of this. While my original heuristic of a one hour reduction turns out to be surprisingly accurate, I had expected light and deep sleep to take most of the time hit. Do I get enough REM sleep? I don’t know how I would answer that.
I did feel fine on the days after melatonin use, but I didn’t track it very systematically. The best I have is the ‘morning feel’ parameter, which the Zeo asks you on waking up; in practice I entered the values as: a ‘2’ means I woke feeling poor or unrested, ‘3’ was fine or mediocre, and ‘4’ was feeling good. When we graph the average of morning feel against melatonin use or non-use, we find that melatonin was noticeably better (2.95 vs 3.17):
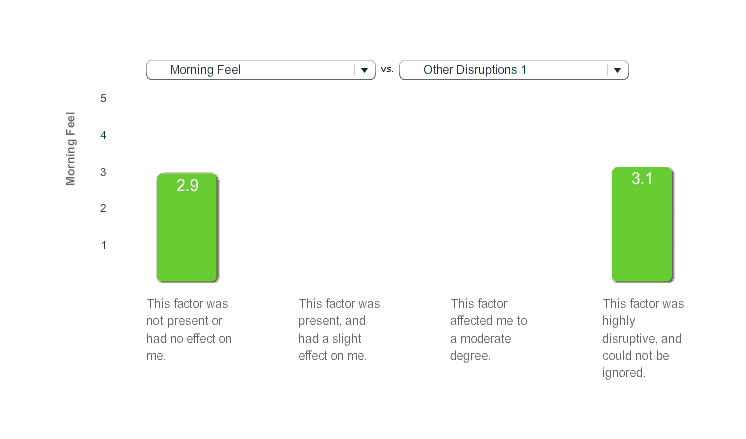
Melatonin, Morning Feel
Graphing some more of the raw data:
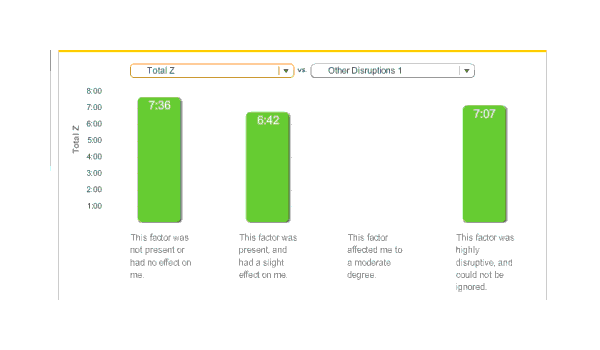
Melatonin, Total Time Asleep (Total Z)
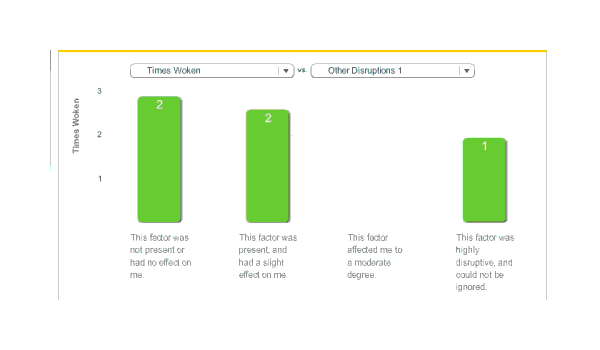
Melatonin, Times Woken per Night
Unfortunately, during this period, I didn’t regularly do my n-backing either, so there’d be little point trying to graph that. What I spent a lot of my free time doing was editing Gwern.net, so it might be worth looking at whether nights on melatonin correspond to increased edits the next day. In this graph of edits, the red dots are days without melatonin and the green are days with melatonin; I don’t see any clear trend, although it’s worth noting almost all of the very busy days were melatonin days:
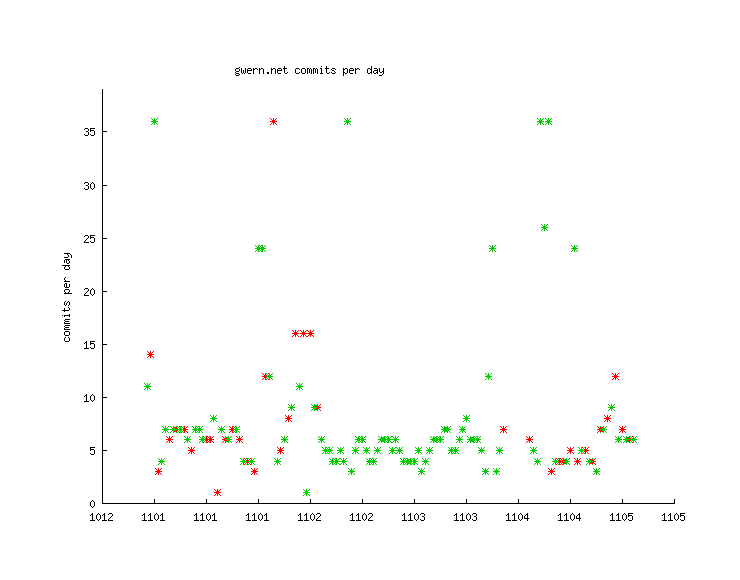
Days versus # of edits versus melatonin on/off
Melatonin Analysis
The data is very noisy (especially towards the end, perhaps as the headband got dirty) and the response variables are intercorrelated which makes interpretation difficult, but hopefully the overall conclusions from the multivariate linear analysis are not entirely untrustworthy. Let’s look at some average. Zeo’s website lets you enter in a 3-valued variable and then graph the average day for each variable against a particular recorded property like ZQ or total length of REM sleep. I defined one dummy variable, and decided that a ‘0’ would correspond to not using melatonin, ‘1’ would correspond to using it, and ‘2’ would correspond to using a double-dose or more (on the rare occasions I felt I needed sleep insurance). The following additional NHST-style5 analyses of p-values is done by importing the CSV into R; given all the issues with self-experimentation (these melatonin days weren’t even blinded), the p-values should be treated as gross guesses, where <0.01 indicates I should take it seriously, <0.05 is pretty good, <0.10 means I shouldn’t sweat it, and anything bigger than 0.20 is, at most, interesting while >0.5 means ignore it; we’ll also look at correcting for multiple comparisons6, for the heck of it. A mnemonic: p-values are about whether the effect exists, and d-values are whether we care. For a visualization of effect sizes, see “Windowpane as a Jar of Marbles”.
The analysis session in the R interpreter:
# Read in data w/ variable names in header; uninteresting columns deleted in OpenOffice.org
zeo <- read.csv("https://gwern.net/doc/zeo/2011-zeo-melatonin.csv")

# "Melatonin" was formerly "SSCF 10";
# I also edited the CSV to convert all '3' to '1' (& so a binary)

l <- lm(cbind(ZQ, Total.Z, Time.to.Z, Time.in.Wake, Time.in.REM,
                 Time.in.Deep, Awakenings, Morning.Feel, Time.in.Light)
            ~ Melatonin, data=zeo)
summary(manova(l))
#           Df Pillai approx F num Df den Df Pr(>F)
# Melatonin    1  0.102    0.717      9     57   0.69
# Residuals 65
summary(l)
# Response ZQ :
#
# Coefficients:
#             Estimate Std. Error t value Pr(>|t|)
# (Intercept)    83.52       4.13   20.21   <2e-16
# Melatonin      2.43       4.99    0.49     0.63
#
# Response Total.Z :
#
# Coefficients:
#             Estimate Std. Error t value Pr(>|t|)
# (Intercept)   452.38      22.86   19.79   <2e-16
# Melatonin       9.68      27.59    0.35     0.73
#
# Response Time.to.Z :
#
# Coefficients:
#             Estimate Std. Error t value Pr(>|t|)
# (Intercept)    19.48       2.59    7.52  2.1e-10
# Melatonin      -5.04       3.13   -1.61     0.11
#
# Response Time.in.Wake :
#
# Coefficients:
#             Estimate Std. Error t value Pr(>|t|)
# (Intercept)    7.095      1.521    4.66  1.6e-05
# Melatonin     -0.247      1.836   -0.13     0.89
#
# Response Time.in.REM :
#
# Coefficients:
#             Estimate Std. Error t value Pr(>|t|)
# (Intercept)   144.62       9.38   15.41   <2e-16
# Melatonin      -3.73      11.32   -0.33     0.74
#
# Response Time.in.Deep :
#
# Coefficients:
#             Estimate Std. Error t value Pr(>|t|)
# (Intercept)    54.33       3.26   16.68   <2e-16
# Melatonin       5.56       3.93    1.41     0.16
#
# Response Awakenings :
#
# Coefficients:
#             Estimate Std. Error t value Pr(>|t|)
# (Intercept)    3.095      0.524    5.90  1.4e-07
# Melatonin     -0.182      0.633   -0.29     0.77
#
# Response Morning.Feel :
#
# Coefficients:
#             Estimate Std. Error t value Pr(>|t|)
# (Intercept)    2.952      0.142   20.78   <2e-16
# Melatonin      0.222      0.171    1.29      0.2
#
# Response Time.in.Light :
#
# Coefficients:
#             Estimate Std. Error t value Pr(>|t|)
# (Intercept)   253.86      13.59   18.68   <2e-16
# Melatonin       7.93      16.40    0.48     0.63
The MANOVA indicates no statistically-significant difference between the groups of days, taking all variables into account (p = 0.69). To summarize the regression:
Variable |
Correlate/Effect |
p-value |
Coefficient’s sign is… |
|---|---|---|---|
|
5.04 |
0.11 |
better |
|
0.18 |
0.77 |
better |
|
0.25 |
0.89 |
better |
|
.56 |
0.16 |
better |
|
.93 |
0.63 |
worse |
|
3.73 |
0.74 |
worse |
|
9.68 |
0.73 |
better |
|
2.43 |
0.63 |
better |
|
.22 |
0.20 |
better |
Part of the problem is that too many days wound up being useless, and each day costs us information and reduces our true sample size. (None of the metrics are strong enough to survive multiple correction7, sadly.)
And also unfortunately, this dataseries doesn’t distinguish between addition to melatonin or benefits from melatonin—perhaps the 3.2 is my ‘normal’ sleep quality and the 2.9 comes from a ‘withdrawal’ of sorts. The research on melatonin doesn’t indicate any addiction effect, but who knows?
If I were to run further experiments, I would definitely run it double-blind, and maybe even test <1.5mg doses as well to see if I’ve been taking too much; 3mg turned out to be excessive, and there are one or two studies indicating that <1mg doses are best for normal people. I wound up using 1.5mg doses. (There could be 3 conditions: placebo, 0.75mg, and 1.5mg. For looking at melatonin effect in general, the data on 2 dosages could be combined. Melatonin has a short half-life, so probably there would be no point in random blocks of more than 2–3 days8: we can randomize each day separately and assume that days are independent of each other.)
Worth comparing are Jayson Virissimo’s preliminary results:
According to the preliminary [Zeo] data, while on melatonin, I seemed to get more total sleep, more REM sleep, less deep sleep, and wake up about the same number of times each night. Because this isn’t enough data to be very confident in the results, I plan on continuing this experiment for at least another 4 months (2 on and 2 off of melatonin) and will analyze the results for the [statistical] significance and magnitude of the effects (if there really are any) while throwing out the outliers (since my sleep schedule is so erratic).
Value of Information (VoI)
See also the discussion as applied to ordering modafinil and testing nootropics
We all know it’s possible to spend more time figuring out how to “save time” on a task than we would actually save time like rearranging books on a shelf or cleaning up in the name of efficiency (xkcd even has a cute chart listing the break-even points for various possibilities,“Is It Worth The Time?”), and similarly, it’s possible to spend more money trying to “save money” than one would actually save; less appreciated is that the same thing is also possible to do with gaining information.
The value of an experiment is the information it produces. What is the value of information? Well, we can take the economic tack and say value of information is the value of the decisions it changes. (Would you pay for a weather forecast about somewhere you are not going to? No. Or a weather forecast about your trip where you have to make that trip, come hell or high water? Only to the extent you can make preparations like bringing an umbrella.)
Wikipedia says that for a risk-neutral person, value of perfect information is “value of decision situation with perfect information”—“value of current decision situation”. (Imperfect information is just weakened perfect information: if your information was not 100% reliable but 99% reliable, well, that’s still worth a lot.)
The decision is the binary take or not take. Melatonin costs ~$15.01$102013 a year (if you buy in bulk during sales, as I did). Suppose I had perfect information it worked; I would not change anything, so the value is $0. Suppose I had perfect information it did not work; then I would stop using it, saving me $15.01$102013 a year in perpetuity, which has a net present value9 (at 5% discounting) of $307.72$2052013. So the best-case value of perfect information—the case in which it changes my actions—is $307.72$2052013, because it would save me from blowing $15.01$102013 every year for the rest of my life. My melatonin experiment is not perfect since I didn’t randomize or double-blind it, but I had a lot of data and it was well powered, with something like a >90% chance of detecting the decent effect size I expected, so the imperfection is just a loss of 10%, down to $276.2$1842013. From my previous research and personal use over years, I am highly confident it works—say, 80%10 . If the experiment says melatonin works, the information is useless to me since I continue using melatonin, and if the experiment says it doesn’t, then let’s assume I decide to quit melatonin11 and then save $15.01$102013 a year or $276.2$1842013 total. What’s the expected value of obtaining the information, given these two outcomes? (0.80 × 0) + (0.20 × 184) = 36.8. Or another way, redoing the net present value: (10 − 0) ⧸ ln 1.05 × 0.9 × 0.2. At minimum wage opportunity cost of $10.51$72013 an hour, $55.24$36.82013 is worth 5.25 hours of my time. I spent much time on screenshots, summarizing, and analysis, and I’d guess I spent closer to 10–15 hours all told.
This worked out example demonstrates that when a substance is cheap and you are highly confident it works, a long costly experiment may not be worth it. (Of course, I would have done it anyway due to factors not included in the calculation: to try out my Zeo, learn a bit about sleep experimentation, do something cool, and have something neat to show everyone.)
Melatonin Data
The data looked much better than the first night, except for a big 2-hour gap where I vaguely recall the sensor headband having slipped off. (I don’t think it was because it was uncomfortable but due to shifting positions or something.) Judging from the cycle of sleep phases, I think I lost data on a REM peak. The REM peaks interest me because it’s a standard theory of polyphasic sleeping that thriving on 2 or 3 hours of sleep a day is possible because REM (and deep sleep) is the only phase that truly matters, and REM can dominate sleep time through REM rebound and training.
Second night
Besides that, I noticed that time to sleep was 19 minutes that night. I also had forgotten to take my melatonin. Hmm…
Since I’ve begun this inadvertent experiment, I’ll try continuing it, alternating days of melatonin usage. I claim in my melatonin article that usage seems to save about 1 hour of sleep/time, but there’s several possible avenues. One could be quicker to fall asleep; one could awake fewer times; and one could have greater percentage of REM or deep sleep, reducing light sleep. (Light sleep doesn’t seem very useful; I sometimes feel worse after light sleep.)
During the afternoon, I took a quick nap. I’m not a very good napper, it seems—only the first 5 minutes registered as even light sleep.
A dose of melatonin (1.5mg) and off to bed a bit early. I’m a little more impressed with the smart alarm; since I’m hard-of-hearing and audio alarms rarely if ever work, I usually use a Sonic Alert vibrating alarm clock. But in the morning I woke up within a minute of the alarm, despite the lack of vibration or flashing lights. (The chart doesn’t reflect this, but as a previous link says, distinguishing waking from sleeping can be difficult and the transitions are the least trustworthy parts of the data.)
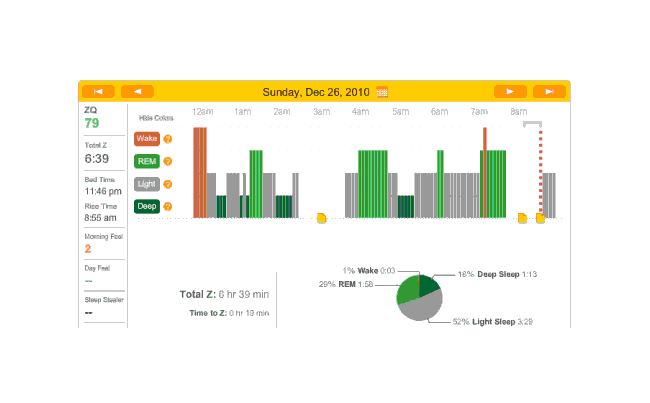
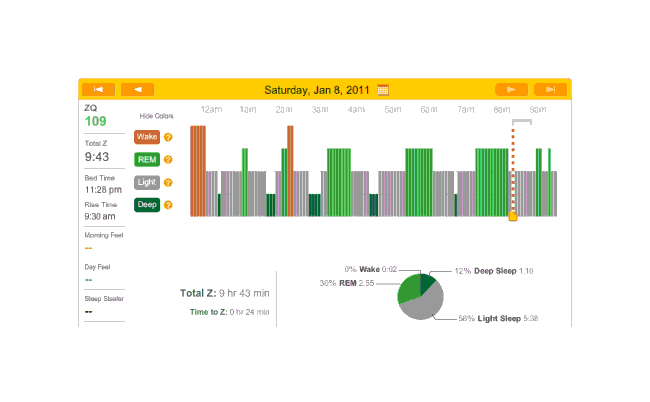
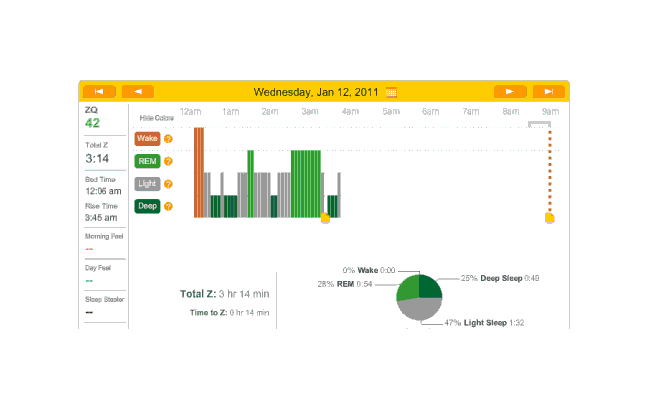
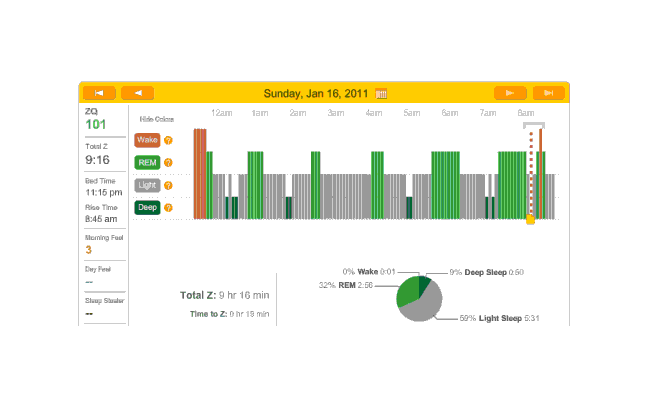
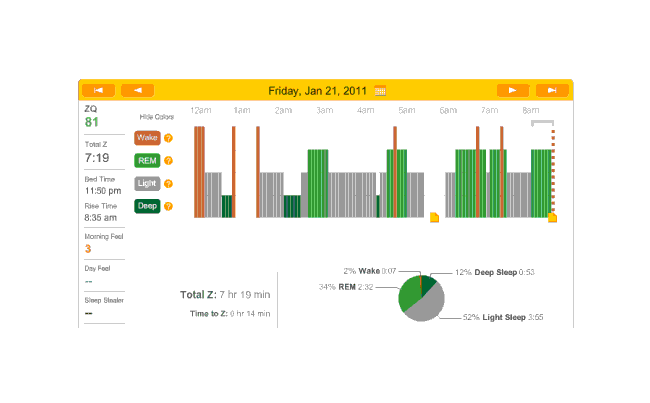
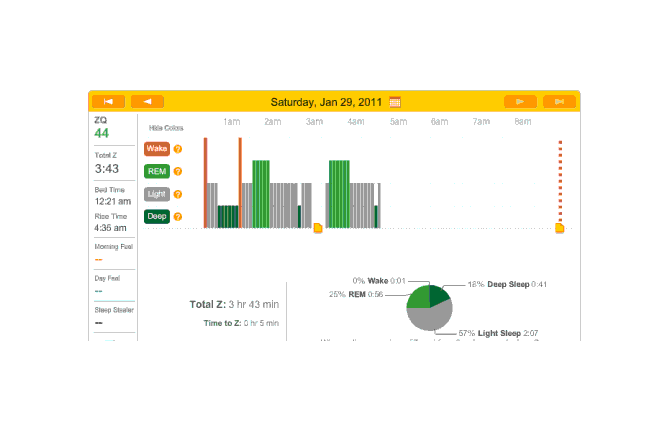
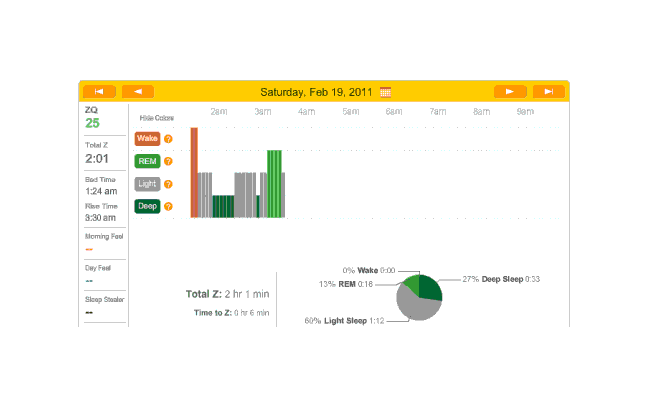
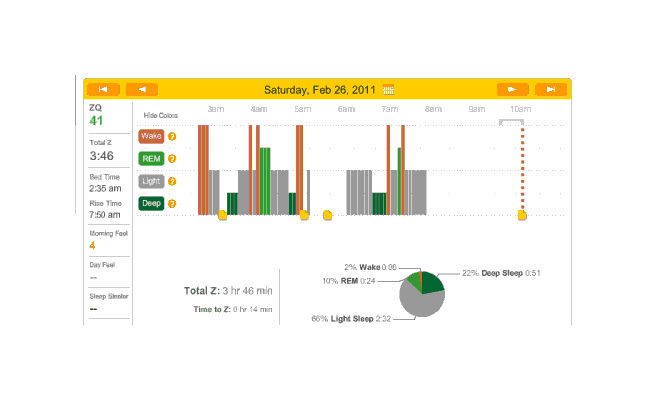
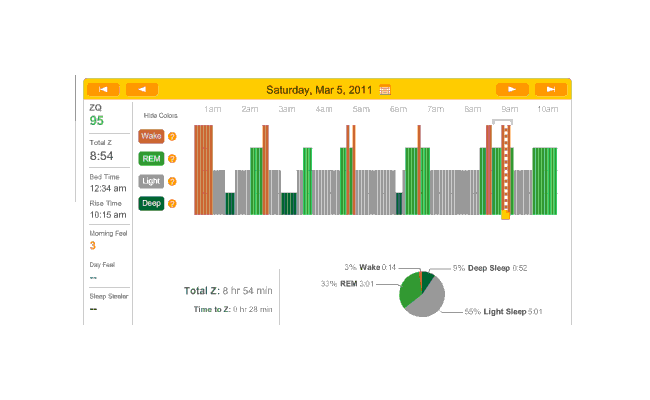
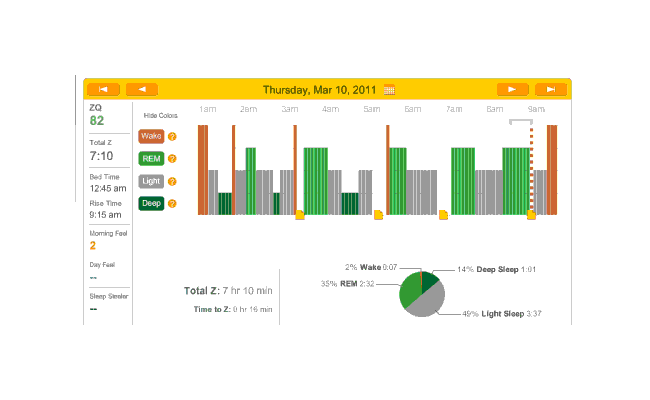
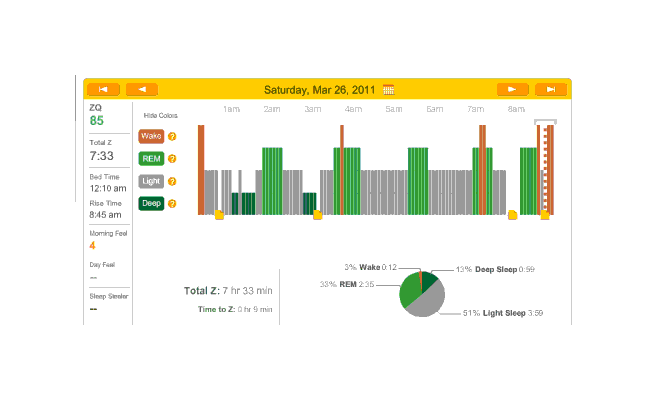
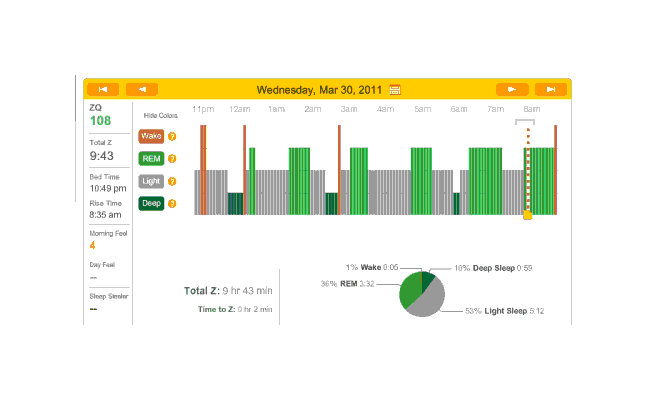
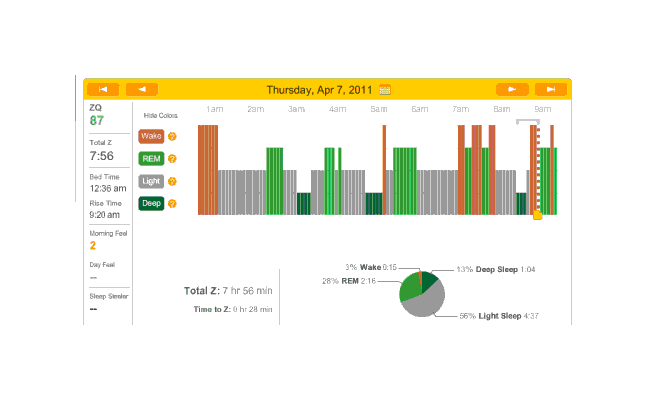
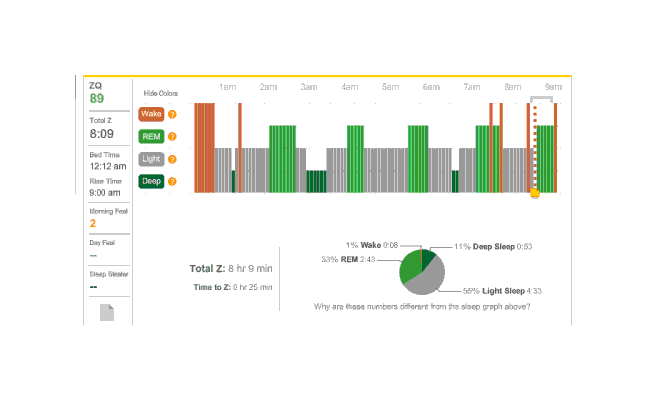
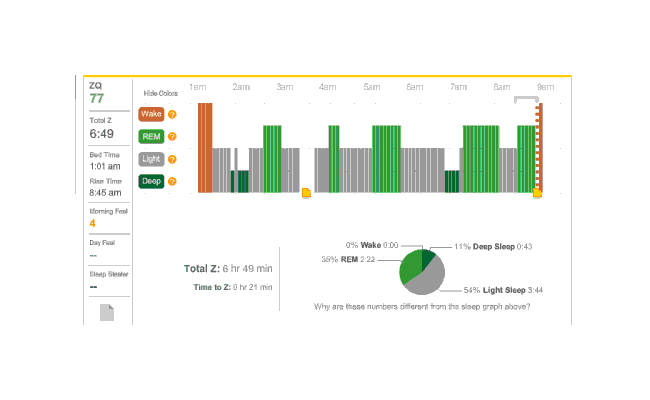
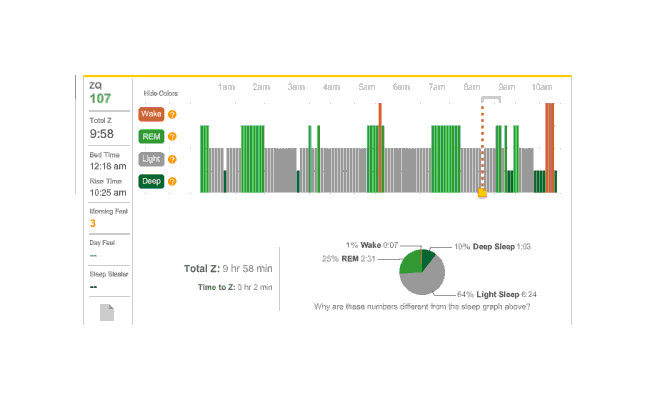
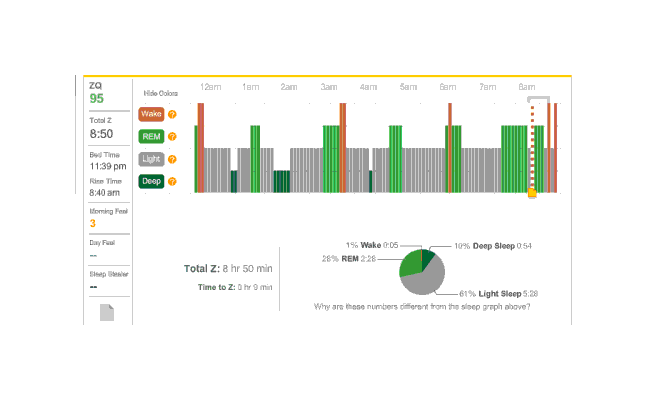
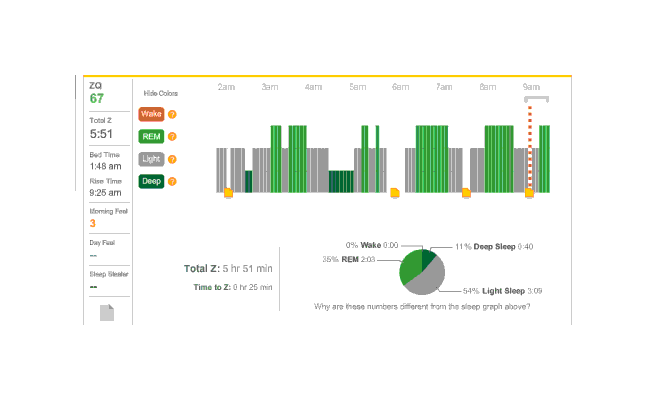
The data was especially good today, with no big gaps:

2010-12-27 ZQ sleep logs
You can see an impressively regular sleep cycle, cycling between REM and light sleep. What’s disturbing is the relative lack of deep sleep—down 4-5% (and there wasn’t a lot to begin with). I suspect that the lack of deep sleep indicates I wasn’t sleeping very well, but not badly enough to wake up, and this is probably due either to light from the Zeo itself—I only figured out how to turn it off a few days later—or my lack of regular blankets and use of a sleeping bag. But the awakenings around 4-6 AM and on other days has made me suspicious that one of the cats is bothering me around here and I’m just forgetting it as I fall asleep.
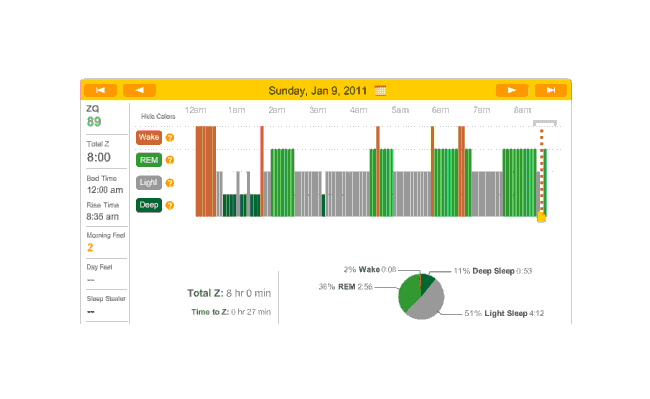
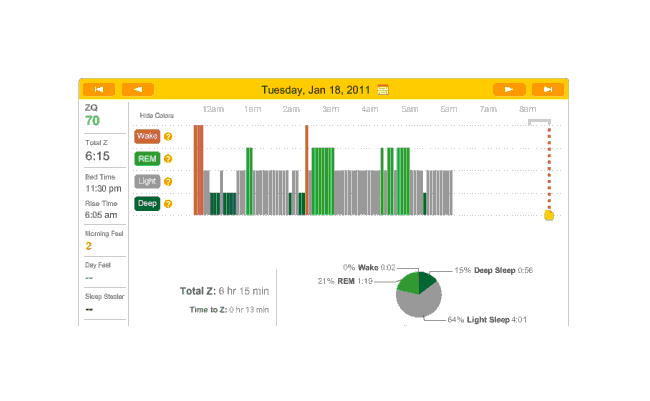
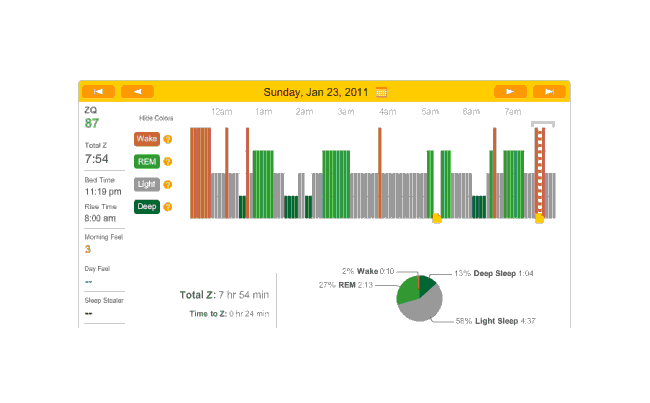
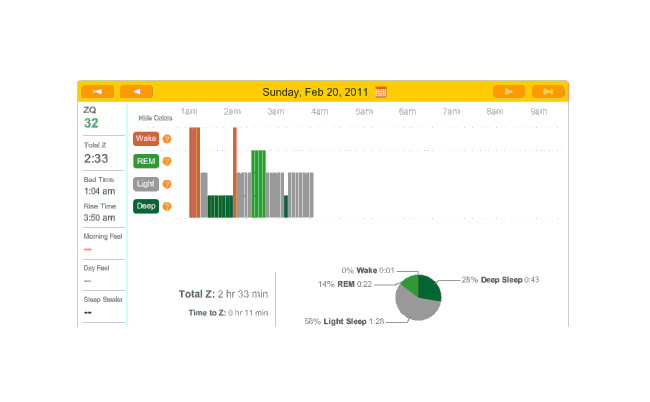
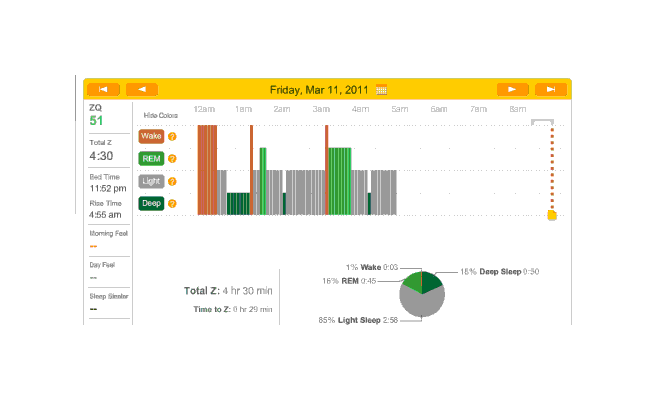
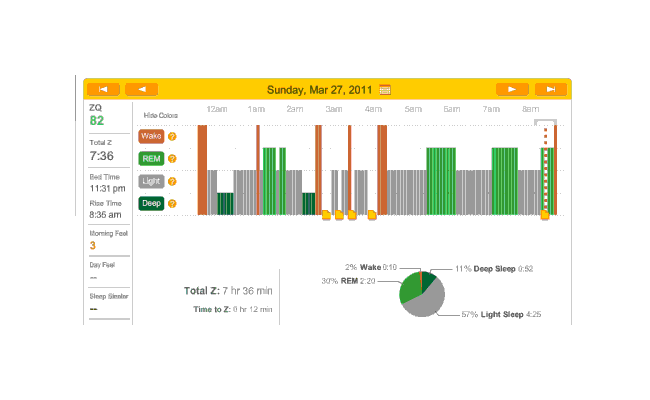
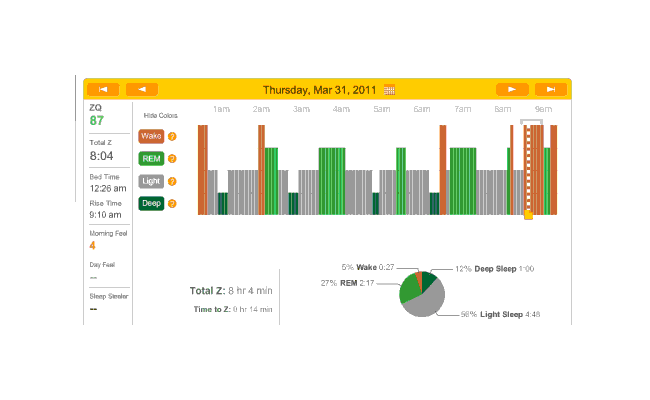
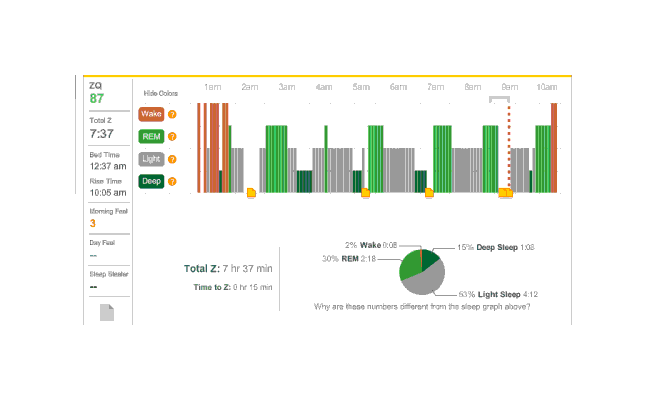
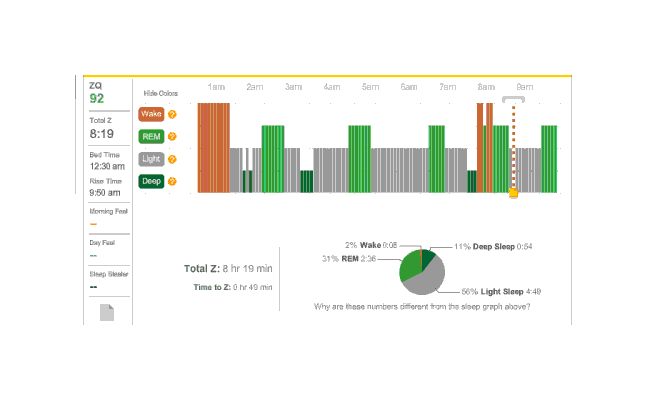
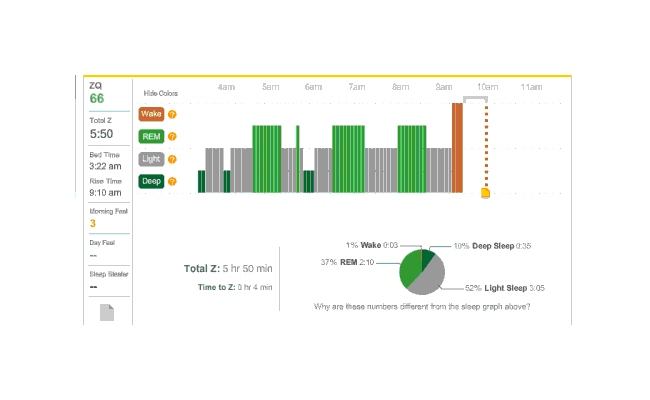
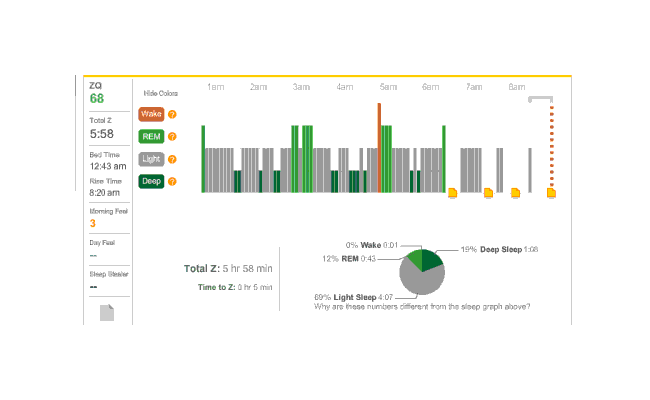
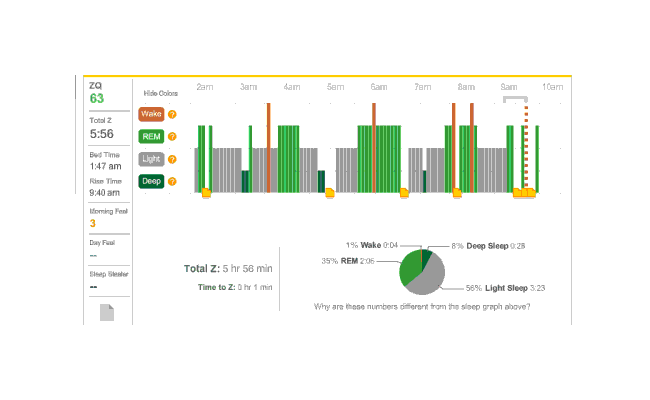
The next night is another no-melatonin night. This time it took 79 minutes to fall asleep. Very bad, but far from unprecedented; this sort of thing is why I was interested in melatonin in the first place. Deep sleep is again limited in dispersion, with a block at the beginning and end, but mostly a regular cycle between light and REM:
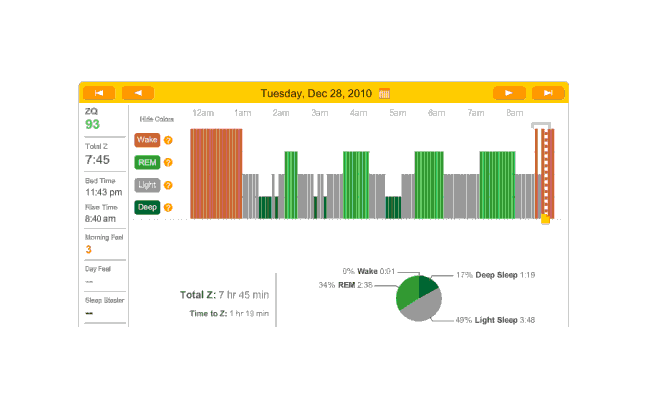
2010-12-28 ZQ sleep logs
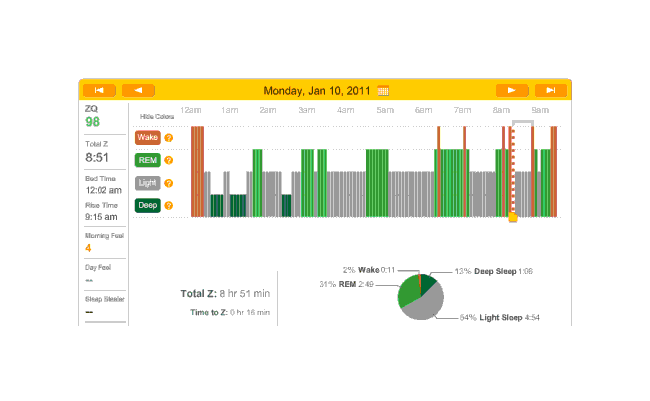
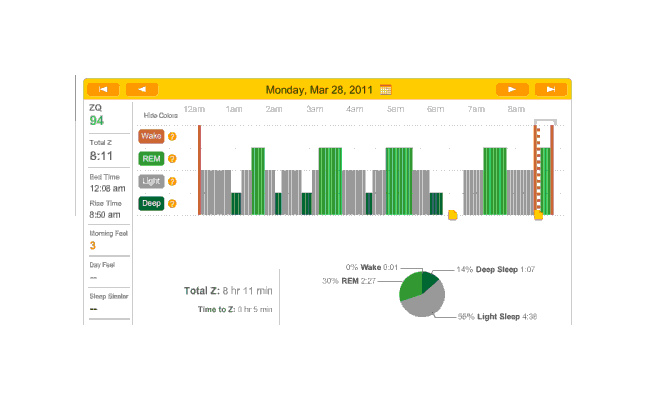
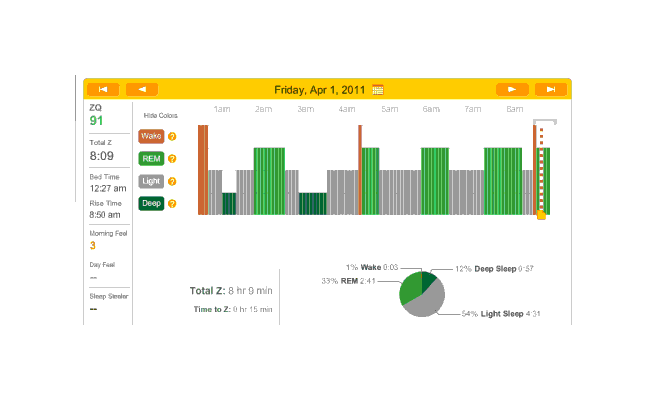
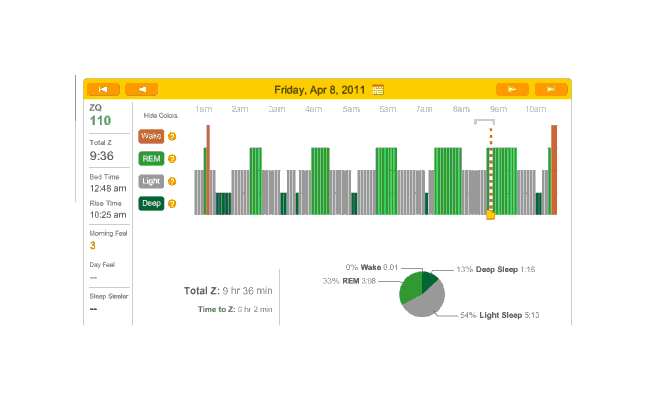
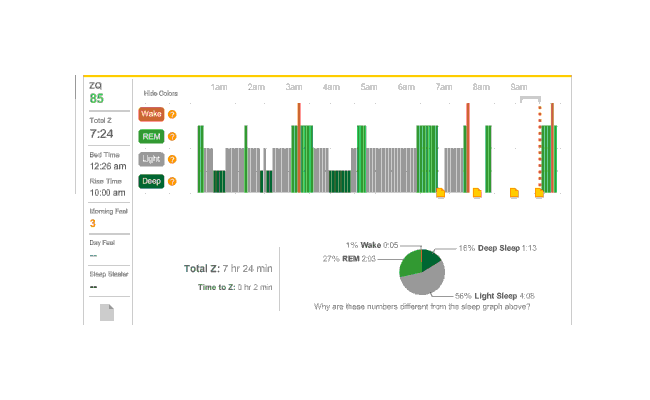
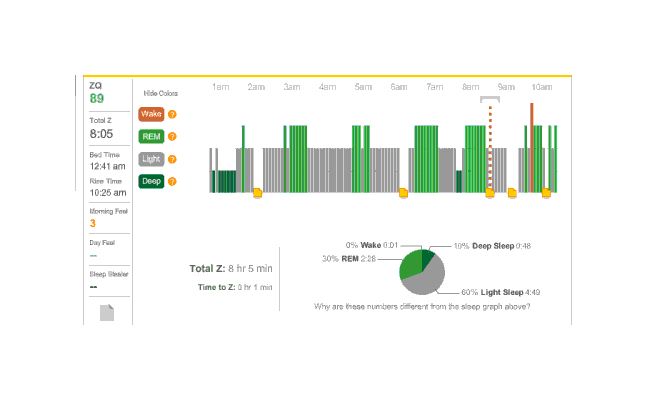
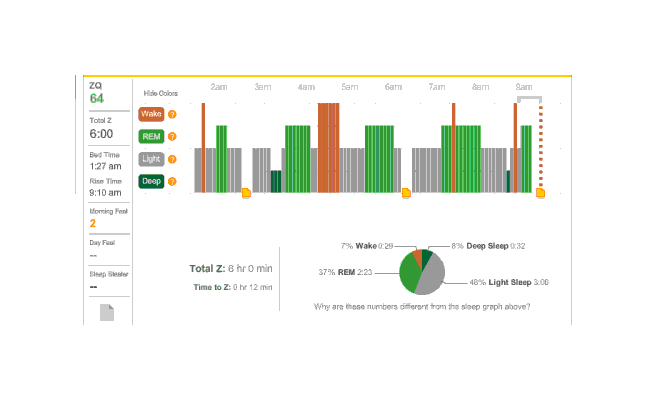
Melatonin night, and 32 minutes to sleep. (I’m starting to notice a trend here.) Another fairly regular cycle of phases, with some deep sleep at the beginning and end; 32 minutes to fall asleep isn’t great but much better than 79 minutes.
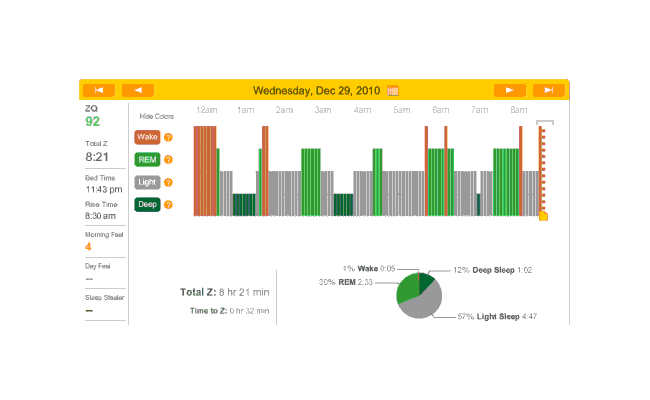
2010-12-29 ZQ sleep logs
Perhaps I should try a biphasic schedule where I sleep for an hour at the beginning and end? That’d seem to pick up most of my deep sleep, and REM would hopefully take care of itself with REM rebound. Need to sum my average REM & deep sleep times (that sum seems to differ quite a bit, eg. one fellow needs 4+ hours. My own need seems to be similar) so I don’t try to pick a schedule doomed to fail.
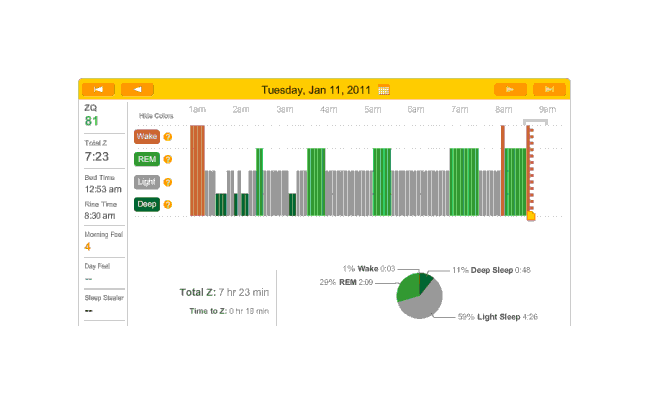
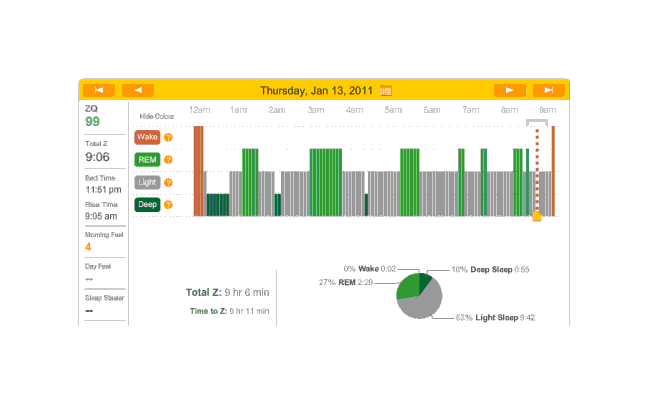
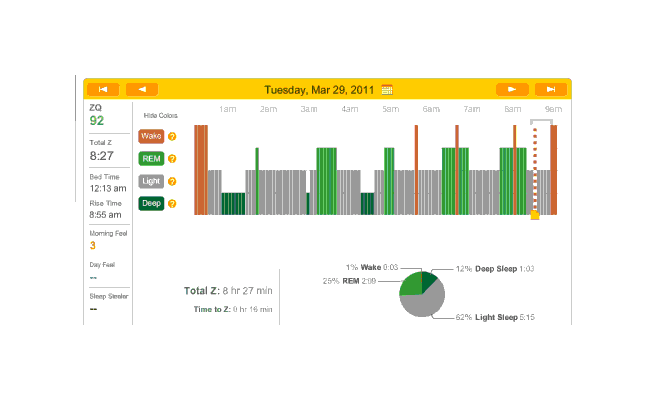
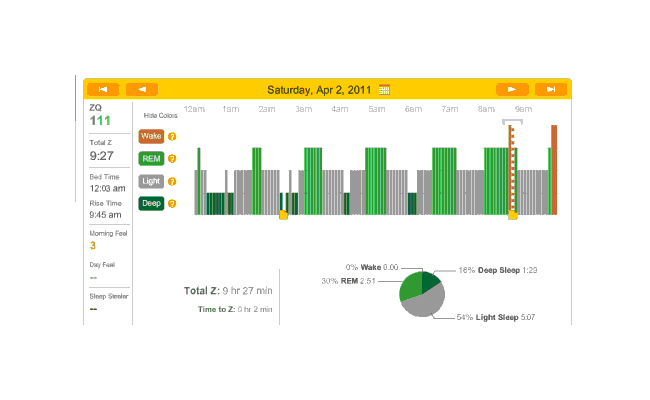
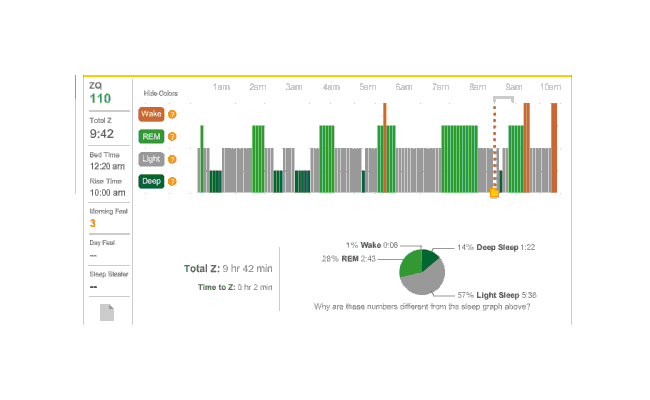
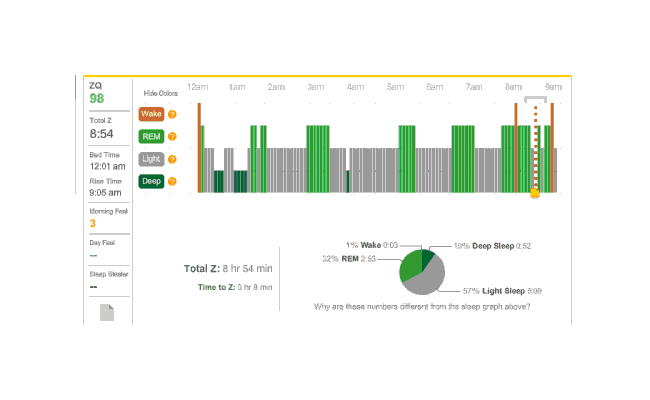
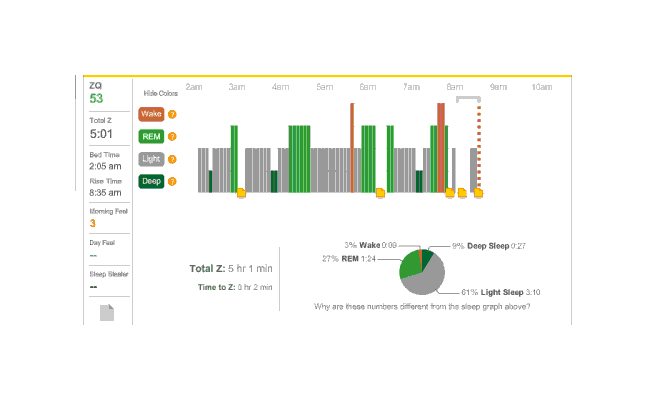
Another night, no melatonin. Time to sleep, just 18 minutes and the ZQ sets a new record even though my cat Stormy woke me up in the morning12:
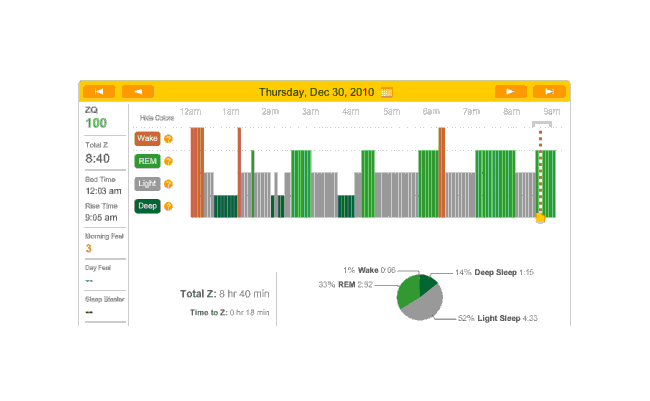
2010-12-30 ZQ sleep logs
I personally blame this on being exhausted from 10 hours working on my transcription of The Notenki Memoirs. But a data point is a data point.
I spend New Year’s Eve pretty much finishing The Notenki Memoirs (transcribing the last of the biographies, the round-table discussion, and editing the images for inclusion), which exhausts me a fair bit as well; the champagne doesn’t help, but between that and the melatonin, I fall asleep in a record-setting 7 minutes. Unfortunately, the headband came off somewhere around 5 AM:
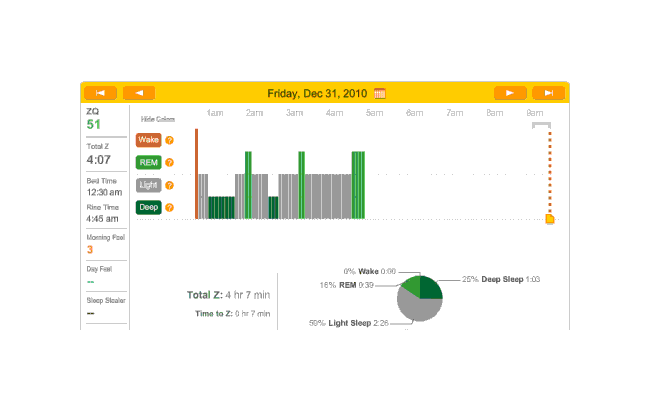
2010-12-31 ZQ sleep logs
A cat? Waking up? Dunno.
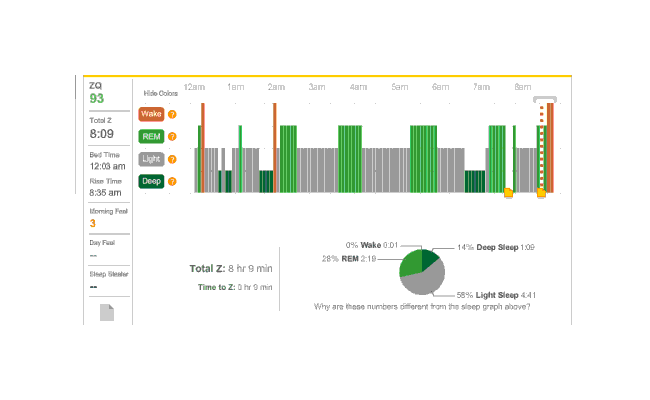
Another relatively quick falling asleep night at 20 minutes. Which then gets screwed up as I simply can’t stay asleep and then the cat begins bothering the heck out of me in the early morning:
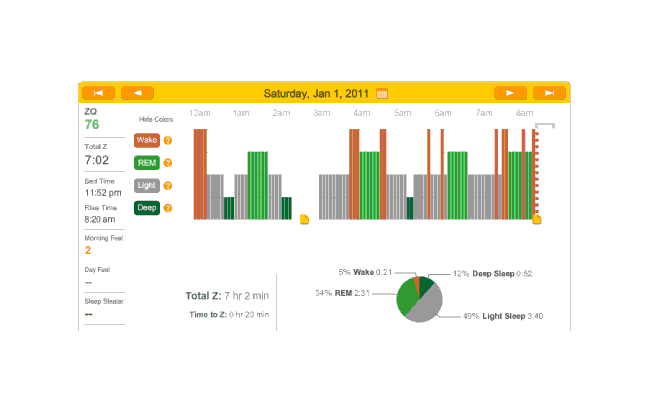
2011-01-01 ZQ sleep logs
Melatonin night, which subjectively didn’t go too badly; 20 minutes to sleep. But lots of wake time (long enough wakes that I remembered them) and 2 or 3 hours not recorded (probably from adjusting my scarf and the headband):
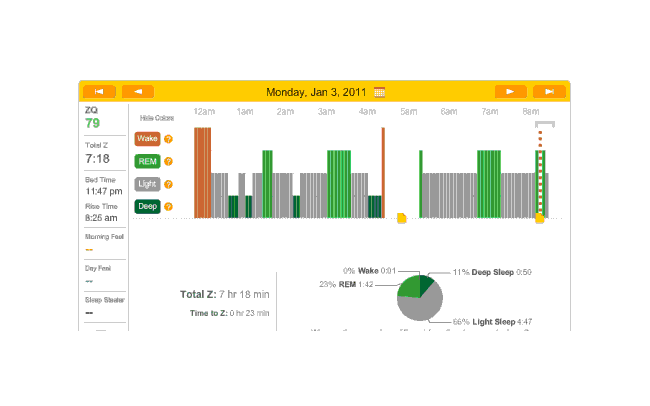
2011-01-03 ZQ sleep logs
Accidentally did another melatonin night (thought Monday was a no-melatonin night). Very good sleep—set records for REM especially towards the late morning which is curious. (The dreams were also very curious. I was an Evangelion character (Kaworu) tasked with riding that kind of carnival-like ride that goes up and drops straight down.) Also another quick falling asleep:
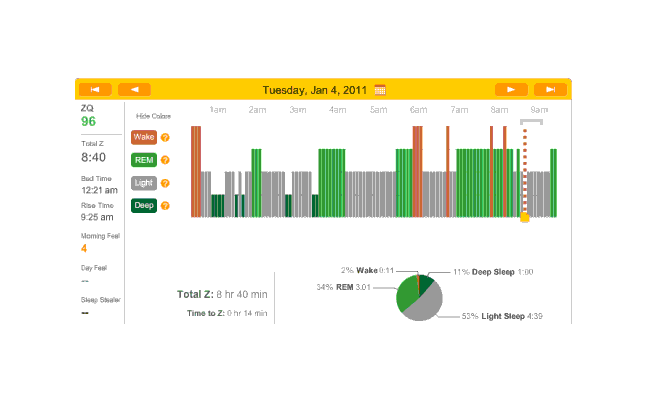
2011-01-04 ZQ sleep logs
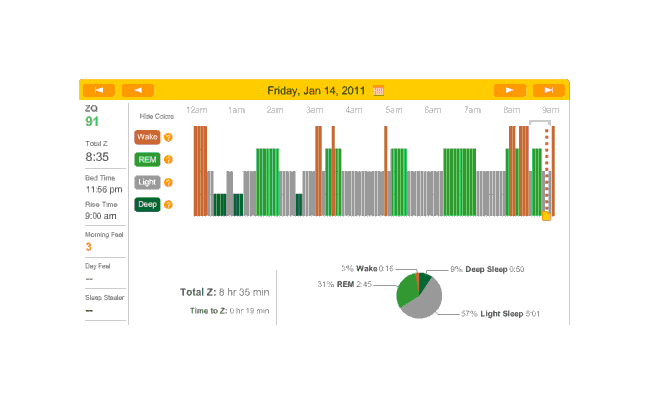
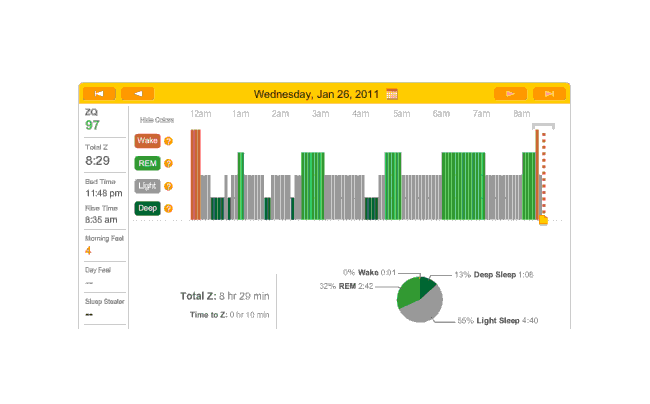
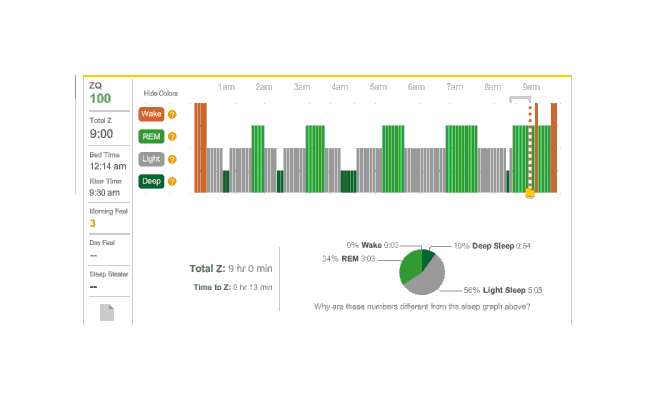
Rather than 3 melatonin nights in a row, I skipped melatonin this night (and thus will have it the next one). Perhaps because I went to sleep so very late, and despite some awakenings, this was a record-setting night for ZQ and TODO deep sleep or REM sleep? :
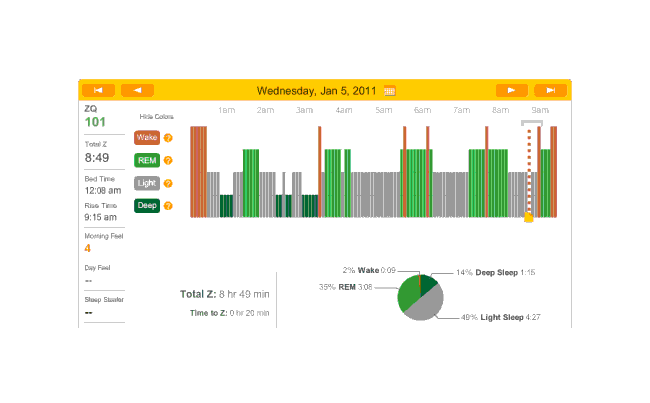
2011-01-05 ZQ sleep logs
I also switched the alarm sounds 2 or 3 days ago to ‘forest’ sounds; they seem somewhat more pleasant than the beeping musical tones. The next night, data is all screwed up. What happened there? It didn’t even record the start of the night, though it seemed to be active and working when I checked right before going to sleep. Odd.
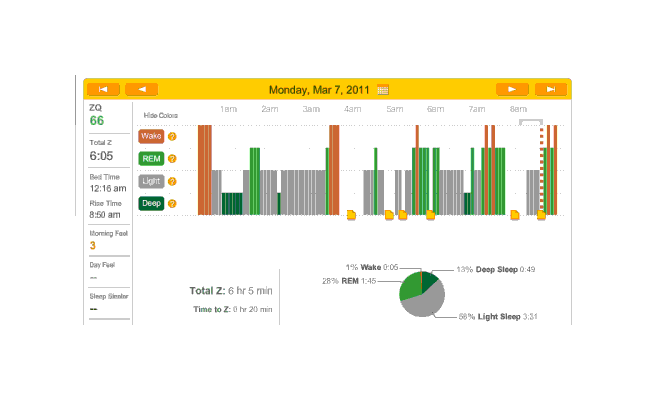
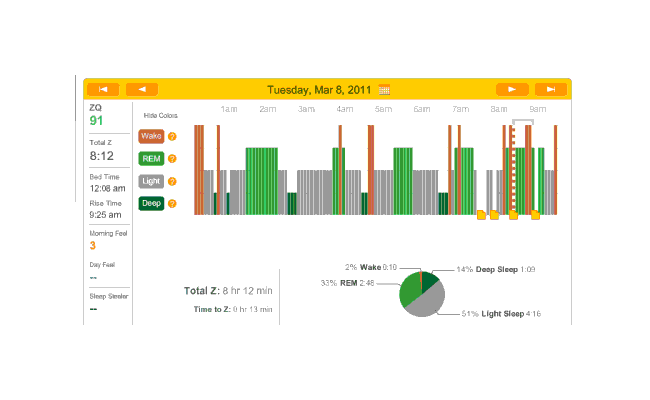
Next 2 days aren’t very interesting; first is no-melatonin, second is melatonin:
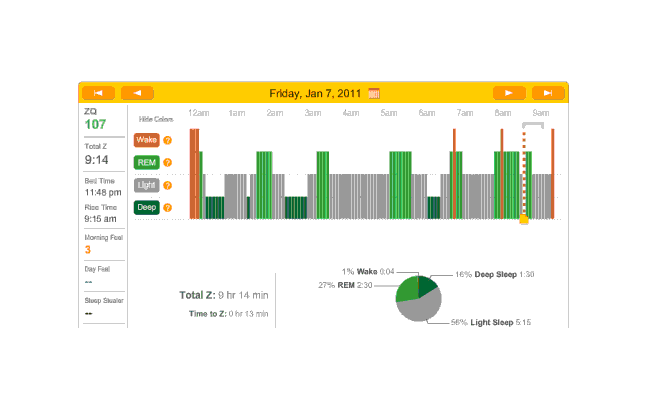
2011-01-07 ZQ sleep logs
2011-01-08 ZQ sleep logs
Off
On
Off
One of my chief Zeo complaints was the bright blue-white LCD screen. I had resorted to turning the base station over and surrounding it with socks to block the light. Then I looked closer at the labels for the buttons and learned that the up-down buttons changed the brightness and the LCD screen could be turned off. And I had read the part of the manual that explained that. D’oh!
On
?
Off
Off (forgot)
On
Off
On
Off

On
Off
Off, but no data on the 22nd. No idea what the problem is—the headset seems to have been on all night.
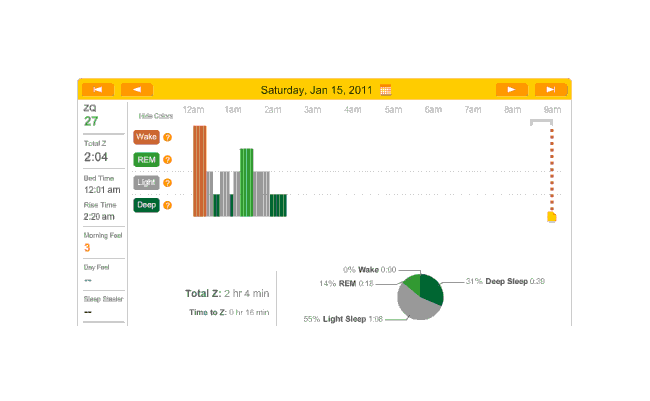
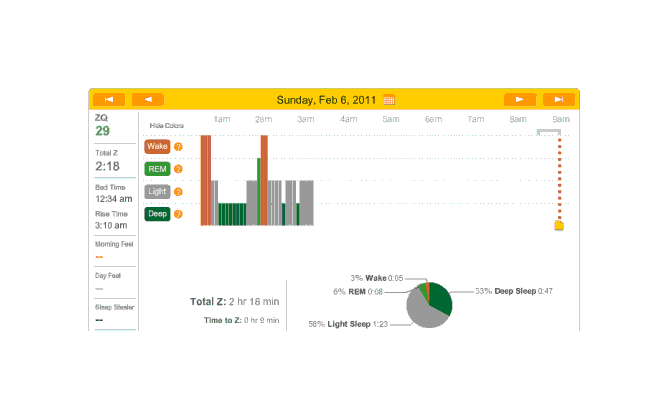
On with a double-dose of melatonin because I was going to bed early; as you can see, didn’t work:
2011-01-23 ZQ sleep logs
Off, no data on the 24th. On, no data on the 25th. I don’t know what went wrong on these two nights.
Off
The 27th (on for melatonin) yielded no data because, frustratingly, the Zeo was printing a ‘write-protected’ error on its screen; I assumed it had something to do with uploading earlier that day—perhaps I had yanked it out too quickly—and put it back in the computer, unmounted and went to eject it. But the memory card splintered on me! It was stuck and the end was splintering and little needles of plastic breaking off. I couldn’t get it out and gave up. The next day (I slept reasonably well) I went back with a pair of needle-nose pliers. I had a backup memory card. After much trial and error, I figured out the card had to be FAT-formatted and have a directory structure that looked like ZEO/ZEOSLEEP.DAT. So that’s that.
Off
On
30: on
31: off
1: on
2: off
3: on
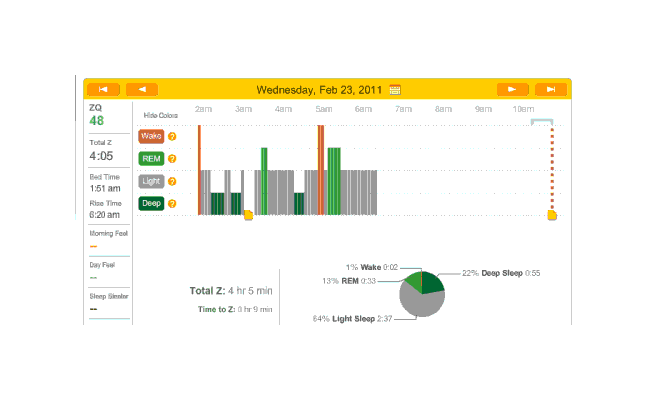
Unfortunately, this night continues a long run of no data. Looking back, it doesn’t seem to have been the fault of the new memory card, since some nights did have enough data for the Zeo website to generate graphs. I suspect that the issue is the pad getting dirty after more than a month of use. I hope so, anyway. I’ll look around for rubbing alcohol to clean it. That night initially starts badly—the rubbing alcohol seemed to do nothing. After some messing around, I figure out that the headband seems to have loosened over the weeks and so while the sensor felt reasonably snug and tight and was transmitting, it wasn’t snug enough. I tighten it considerably and actually get some decent data:
Off
5: on
Off
7: on
8: off
9: on
Off
11: on?
The previous night, I began paying closer attention to when it was and was not reading me (usually the latter). Pushing hard on it made it eventually read me, but tightening the headband hadn’t helped the previous several nights. Pushing and not pushing, I noticed a subtle click. Apparently the band part with the metal sensor pad connects to the wireless unit by 3 little black metal nubs; 2 were solidly in place, but the third was completely loose. Suspicious, I try pulling on the band without pushing on the wireless unit—leaving the loose connection loose. Sure enough, no connection was registered. I push on the unit while loosing the headband—and the connection worked. I felt I finally had solved it. It wasn’t a loose headband or me pulling it off at night or oils on the metal sensors or a problem with the SD card. I was too tired to fix it when I had the realization, but resolved the next morning to fix it by wrapping a rubber band around the wireless unit and band. This turned out to not interfere with recharging, and when I took a short nap, the data looked fine and gapless. So! The long data drought is hopefully over.
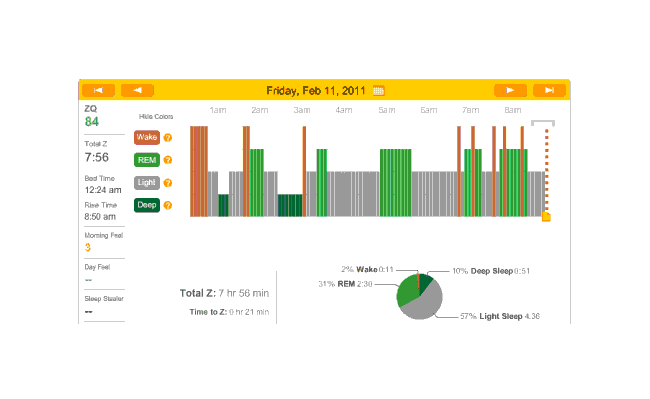
2011-02-11 ZQ sleep logs
Off
On
Off
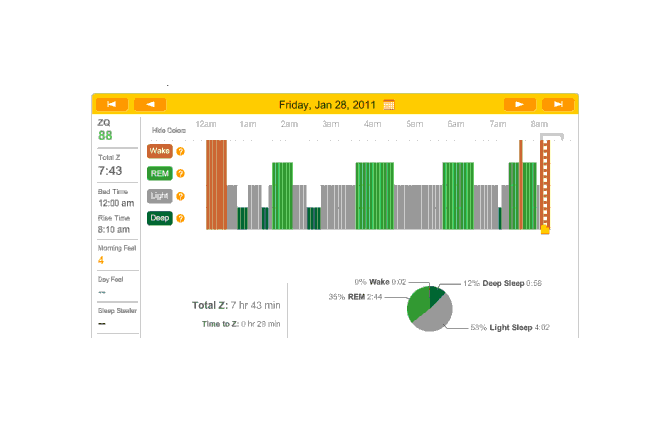
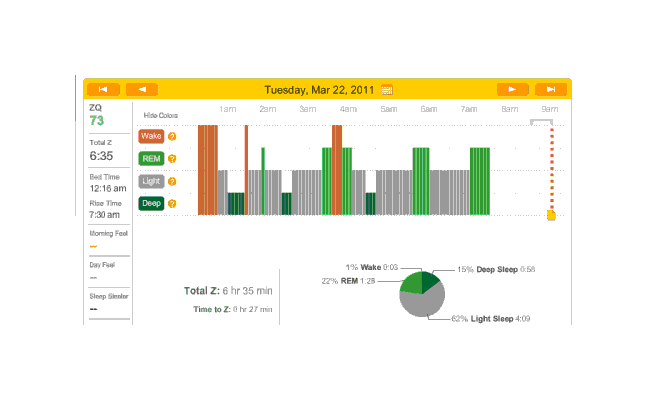
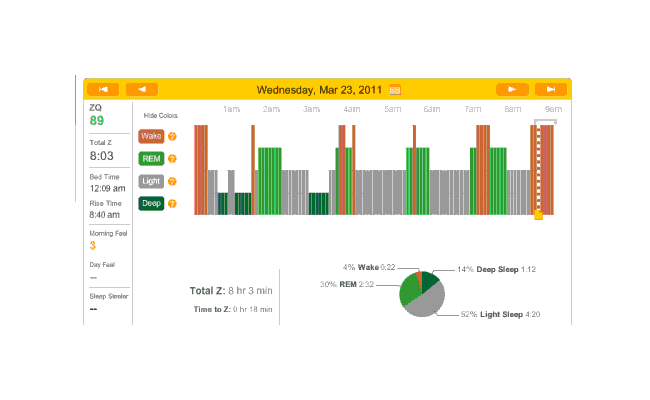
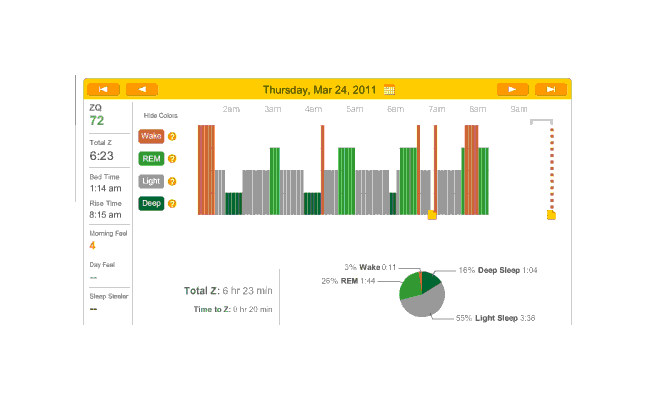
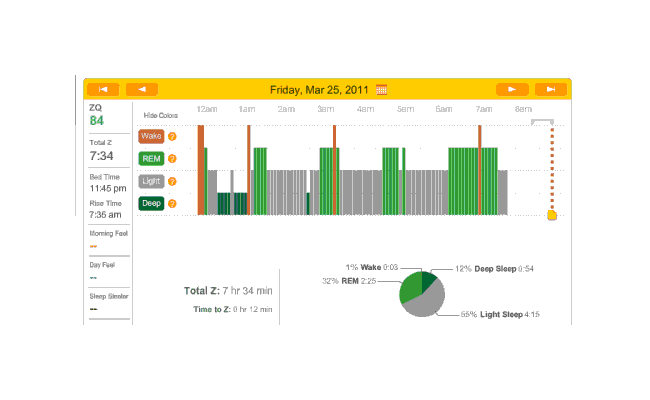
On the 15th of February, I had a very early flight to San Francisco. That night and every night from then on, I was using melatonin, so we’ll just include all the nights for which any sensible data was gathered. Oddly enough, the data and ZQs seem bad (as one would expect from sleeping on a couch), but I wake up feeling fairly refreshed. By this point we have the idea how the sleep charts work, so I will simply link them rather than display them.
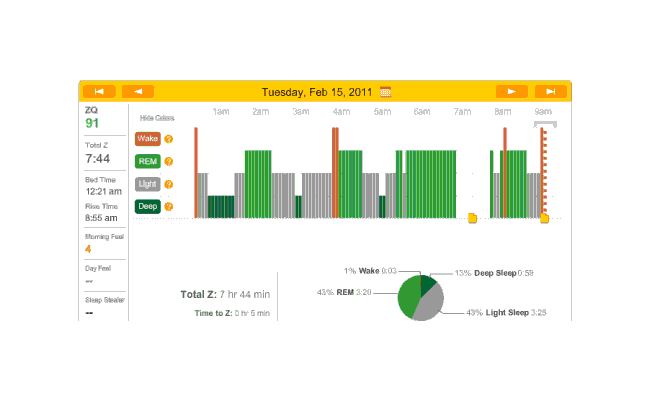
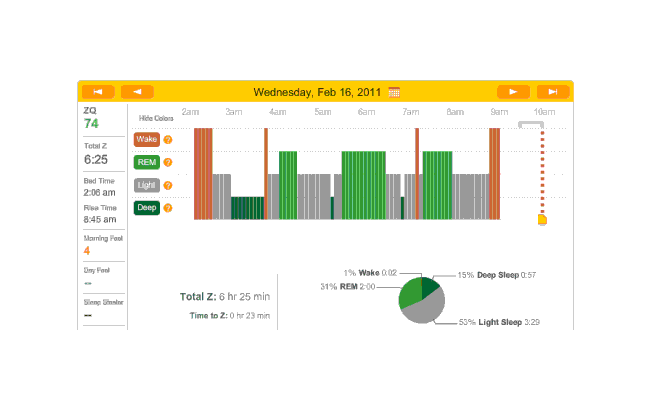
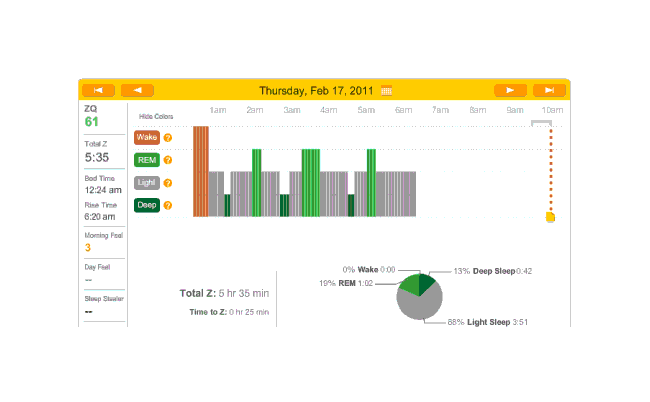
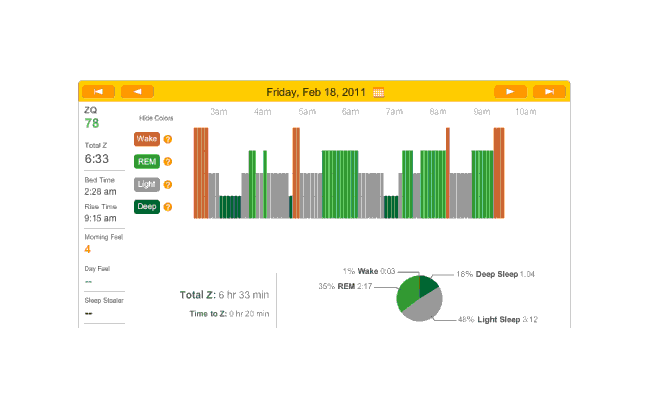
Then I took a long break on updating this page; when I had a month or two of data, I uploaded to Zeo again, and buckled down and figured out how to have ImageMagick crop pages. The shell script (for screenshots of my browser, YMMV) is for file in *.png; do mogrify +repage -crop 700x350+350+285 $file; done;
General observations: almost all these nights were on melatonin. Not far into this period, I realized that the little rubber band was not working, and I hauled out my red electrical tape and tightened it but good; and again, you can see the transition from crappy recordings to much cleaner recordings. The rest of February:
March:
April:
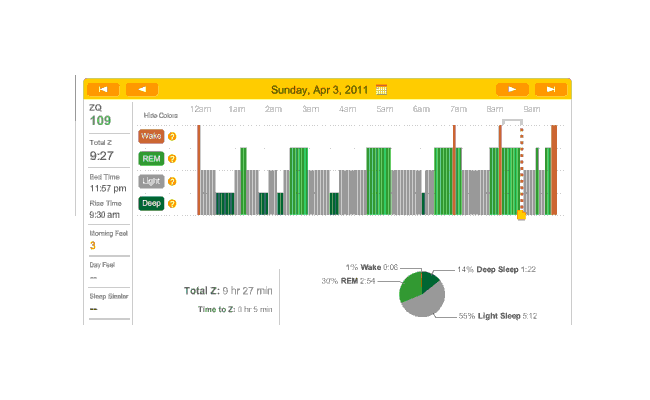
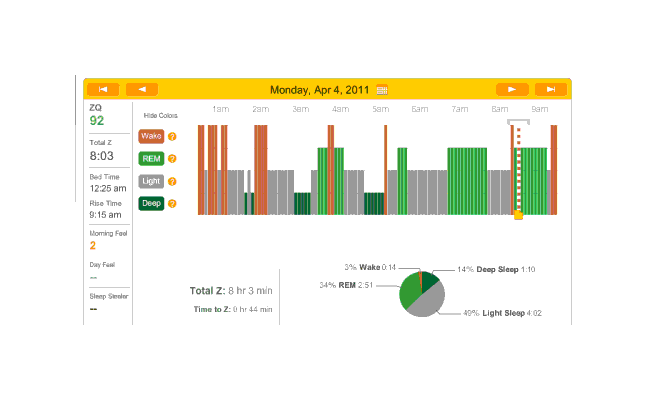
April 4th was one of the few nights that I was not on melatonin during this timespan; I occasionally take a weekend and try to drop all supplements and nootropics besides the multivitamins and fish oil, which includes my melatonin pills. This night (or more precisely, that Sunday evening) I also stayed up late working on my computer, getting in to bed at 12:25 AM. You can see how well that worked out. During the 2 AM wake period, it occurred to me that I didn’t especially want to sacrifice a day to show that computer work can make for bad sleep (which I already have plenty of citations for in the Melatonin essay), and I gave in, taking a pill. That worked out much better, with a relatively normal number of wakings after 2 AM and a reasonable amount of deep & REM sleep.
Exercise
One-Legged Standing
Seth Roberts found that for him, standing a lot helped him sleep. This seems very plausible to me—more fatigue to repair, closer to ancestral conditions of constant walking—and tallied with my own experience. (One summer I worked at a summer camp, where I spent the entire day on my feet; I always slept very well though my bunk was uncomfortable.) He also found that stressing his legs by standing on one at a time for a few minutes also helped him sleep. That did not seem as plausible to me. But still worth trying: standing is free, and if it does nothing, at least I got a little more exercise.
Roberts tried a fairly complicated randomized routine. I am simply alternating days as with melatonin (note that I have resumed taking melatonin every day). My standing method is also simple; for 5 minutes, I stand on one leg, rise up onto the ball of my foot (because my calves are in good shape), and then sink down a foot or two and hold it until the burning sensation in my thigh forces me to switch to the other leg. (I seem to alternate every minute.) I walk my dog most every day, so the effect is not as simple as ‘some moderate exercise that day’; in the next experiment, I might try 5 minutes of dumbbell bicep curls instead.
One-Legged Standing Analysis
The initial results were promising. Of the first 5 days, 3 are ‘on’ and 2 are off; all 3 on-days had higher ZQs than the 2 off-days. Unfortunately, the full time series did not seem to bear this out. Looking at the ~70 recorded days between 2011-06-11 and 2011-08-27 (raw CSV data), the raw uncorrected averages looked like this (as before, the ‘3’ means the intervention was used, ‘0’ that it was not):

Standing ZQ vs non-standing

Morning feel rating

Total sleep time

Total deep sleep time

Total REM sleep time

Number of times woken

Total time awake
R analysis, using multivariate linear regression13 turns in a non-statistically-significant value for one-leggedness in general (p = 0.23); by variable:
Variable |
Effect |
p-value |
Coefficient’s sign is… |
|---|---|---|---|
|
-1.24 |
0.16 |
worse |
|
-4.09 |
0.37 |
worse |
|
0.47 |
0.51 |
worse |
|
-0.37 |
0.80 |
better |
|
-5.33 |
0.02 |
worse |
|
2.76 |
0.38 |
worse |
|
-1.56 |
0.10 |
worse |
|
-0.05 |
0.79 |
better |
|
-0.05 |
0.32 |
worse |
No p-values survived multiple-correction14:.
While I did not replicate Roberts’s setup exactly in the interest of time and ease, and it was not blinded, I tried to compensate with an unusually large sample: 69 nights of data. This was a mixed experiment: there seems to be an negative effect, but none of the changes seem to have large effect sizes or strong p-values.
The one-legged standing was not in exclusion to melatonin use, but I had used it most every night. I thought I might go on using one-legged standing, perhaps skipping it on nights when I am up particularly late or lack the willpower, but I’ve abandoned it because it is a lot of work to use and the result looked weak. In the future, I should look into whether walks before bedtime help.
Vitamin D
Potassium
LSD Microdosing
Alcohol
Suspicious that alcohol was delaying my sleep and worsening my sleep when I did finally go to bed, I recorded my alcohol consumption for a year. Correlating alcohol use against when I go to bed shows no interesting correlation, nor with any of the other sleep variables Zeo records, even after correcting for a shift in my sleep patterns over that year. So it would seem I was wrong.
In May 201313ya, I began to wonder if alcohol was damaging my sleep; I don’t drink alcohol too often and never more than a glass or two, so I don’t have any tolerance built up. I noticed that on nights when I drank some red wine or had some of my mead, it seemed to take me much longer to fall asleep and I would regularly wake up in the middle of the night. So I began noting down days on which I drank any alcohol, to see if it correlated with sleep problems (and probably then just refrain from alcohol in the evening, since I don’t care enough to run a randomized experiment).
In May 201412ya, I ran out of all my mead and also a gallon of burgundy wine I had bought to make beef bourguignon with, so that marked a natural close to the data collection. I compiled the alcohol data along with the Zeo data in the relevant time period, and looked at the key metrics with a multivariate multiple regression. The main complexity here is that I earlier discovered that I had gradually shifted my sleep down and now Start.of.Night looks like a sigmoid, so to control for that, I fit a sigmoid to the Date using nonlinear least squares, and then plugged the estimated values in. The code, showing only the results for the Alcohol boolean:
drink <- read.csv("https://gwern.net/doc/zeo/2014-gwern-alcohol.csv")
library(minpack.lm)
summary(nlsLM(Start.of.Night ~ Alcohol + as.integer(Date) + (a / (1 + exp(-b * (as.integer(Date) - c)))),
              start = list(a = 6.15e+05, b = -1.18e-04, c = -5.15e+04),
              control=(nls.lm.control(ftol = sqrt(.Machine$double.eps)/4.9, maxfev=1024, maxiter=1024)),
              data=drink))
# Parameters:
#    Estimate Std. Error t value Pr(>|t|)
# a  5.61e+06   6.49e+09    0.00     1.00
# b -1.00e-03   2.44e-04   -4.10  4.8e-05
# c -8.26e+03   1.16e+06   -0.01     0.99
summary(lm(cbind(Start.of.Night, Time.to.Z, Time.in.Wake, Awakenings, Morning.Feel, Total.Z, Time.in.REM, Time.in.Deep) ~
                  Alcohol +
                  as.integer(Date) + I(5.61e+06 / (1 + exp(-(1.00e-03) * (as.integer(Date) - (-8.26e+03))))),
                 data=drink))
# Response Start.of.Night :
# Coefficients:
#                                                                Estimate Std. Error t value Pr(>|t|)
# AlcoholTRUE                                                   -8.96e-01   4.75e+00   -0.19     0.85
#
# Response Time.to.Z :
# Coefficients:
#                                                                Estimate Std. Error t value Pr(>|t|)
# AlcoholTRUE                                                   -2.50e+00   1.41e+00   -1.77    0.077
#
# Response Time.in.Wake :
# Coefficients:
#                                                                Estimate Std. Error t value Pr(>|t|)
# AlcoholTRUE                                                   -2.04e+00   2.40e+00   -0.85   0.3956
#
# Response Awakenings :
# Coefficients:
#                                                                Estimate Std. Error t value Pr(>|t|)
# AlcoholTRUE                                                   -2.03e-01   2.85e-01   -0.71     0.48
#
# Response Morning.Feel :
# Coefficients:
#                                                                Estimate Std. Error t value Pr(>|t|)
# AlcoholTRUE                                                   -5.03e-02   9.16e-02   -0.55   0.5836
#
# Response Total.Z :
# Coefficients:
#                                                                Estimate Std. Error t value Pr(>|t|)
# AlcoholTRUE                                                    1.04e+01   7.89e+00    1.32     0.19
#
# Response Time.in.REM :
# Coefficients:
#                                                                Estimate Std. Error t value Pr(>|t|)
# (Intercept)                                                    7.59e+05   9.83e+05    0.77     0.44
# AlcoholTRUE                                                    1.84e+00   3.58e+00    0.51     0.61
#
# Response Time.in.Deep :
# Coefficients:
#                                                                Estimate Std. Error t value Pr(>|t|)
# AlcoholTRUE                                                    1.14e+00   1.41e+00    0.80     0.42
Zilch. No correlation is at all interesting.
So it looks like alcohol—at least in the small quantities I consume—makes no difference.
Timing
Bed Time for Better Sleep
Someone asked if I could turn up a better bedtime using their Zeo data. I accepted, but the sleep data comes with quite a few variables and it’s not clear which variable is the ‘best’—for example, I don’t think much of the ZQ variable, so it’s not as simple as regressing ZQ ~ Bedtime and finding what value of Bedtime maximizes ZQ. I decided that I could try finding the optimal bedtime by two strategies:
look for some underlying factor of good sleep using factor analysis—I’d expect maybe 2 or 3 factors, one for total sleep, one for insomnia, and maybe one for REM sleep—and maximize the good ones and minimize the bad ones, equally weighted
just do a multivariate regression and weight each variable equally
So, setup:
zeo <- read.csv("https://gwern.net/doc/zeo/gwern-zeodata.csv")
zeo$Sleep.Date <- as.Date(zeo$Sleep.Date, format="%m/%d/%Y")
## convert "05/12/2014 06:45" to "06:45"
zeo$Start.of.Night <- sapply(strsplit(as.character(zeo$Start.of.Night), " "), function(x) { x[2] })
## convert "06:45" to 24300
interval <- function(x) { if (!is.na(x)) { if (grepl(" s",x)) as.integer(sub(" s","",x))
                                           else { y <- unlist(strsplit(x, ":")); as.integer(y[[1]])*60 + as.integer(y[[2]]); }
                                         }
                          else NA
                        }
zeo$Start.of.Night <- sapply(zeo$Start.of.Night, interval)
## correct for the switch to new unencrypted firmware in March 2013;
## I don't know why the new firmware subtracts 15 hours
zeo[(zeo$Sleep.Date >= as.Date("2013-03-11")),]$Start.of.Night
 <- (zeo[(zeo$Sleep.Date >= as.Date("2013-03-11")),]$Start.of.Night + 900) %% (24*60)

## after midnight (24*60=1440), Start.of.Night wraps around to 0, which obscures any trends,
## so we'll map anything before 7AM to time+1440
zeo[zeo$Start.of.Night<420 & !is.na(zeo$Start.of.Night),]$Start.of.Night
 <- (zeo[zeo$Start.of.Night<420 & !is.na(zeo$Start.of.Night),]$Start.of.Night + (24*60))

## keep only the variables we're interested in:
zeo <- zeo[,c(2:10, 23)]
## define naps or nights with bad data as total sleep time under ~1.5 hours (100m) & delete
zeo <- zeo[zeo$Total.Z>100,]
write.csv(zeo, file="bedtime-factoranalysis.csv", row.names=FALSE)
Let’s begin with a simple factor analysis, looking for a ‘good sleep’ factor. Zeo Inc apparently was trying for this with the ZQ variable but I’ve always been suspicious of it because it doesn’t seem to track Morning.Feel or Awakenings very well but simply be how long you slept (Total.Z):
zeo <- read.csv("https://gwern.net/doc/zeo/2014-07-26-bedtime-factoranalysis.csv")
library(psych)
nfactors(zeo)
# VSS complexity 1 achieves a maximimum of 0.8  with  6  factors
# VSS complexity 2 achieves a maximimum of 0.94  with  6  factors
# The Velicer MAP achieves a minimum of 0.09  with  1  factors
# Empirical BIC achieves a minimum of  466.5  with  5  factors
# Sample Size adjusted BIC achieves a minimum of  39396  with  5  factors
#
# Statistics by number of factors
#    vss1 vss2   map dof chisq prob sqresid  fit RMSEA   BIC SABIC complex  eChisq    eRMS eCRMS eBIC
# 1  0.71 0.00 0.090  35 41394    0  6.4648 0.71  0.99 41145 41256     1.0 1.8e+03 0.12926  0.15 1577
# 2  0.77 0.85 0.099  26 40264    0  3.3366 0.85  1.13 40079 40162     1.2 9.4e+02 0.09275  0.12  755
# 3  0.78 0.89 0.139  18 40323    0  2.1333 0.91  1.36 40195 40253     1.4 9.0e+02 0.09075  0.14  772
# 4  0.75 0.89 0.216  11 39886    0  1.3401 0.94  1.73 39808 39843     1.5 8.0e+02 0.08560  0.17  722
# 5  0.78 0.89 0.280   5 39415    0  0.7267 0.97  2.56 39380 39396     1.4 5.0e+02 0.06779  0.20  467
# 6  0.80 0.94 0.450   0 38640   NA  0.3194 0.99    NA    NA    NA     1.2 2.2e+02 0.04479    NA   NA
# 7  0.80 0.92 0.807  -4 37435   NA  0.1418 0.99    NA    NA    NA     1.2 1.0e+02 0.03075    NA   NA
# 8  0.78 0.91 4.640  -7 30474   NA  0.0002 1.00    NA    NA    NA     1.3 2.5e-02 0.00048    NA   NA
# 9  0.78 0.91   NaN  -9 30457   NA  0.0002 1.00    NA    NA    NA     1.3 2.5e-02 0.00048    NA   NA
# 10 0.78 0.91    NA -10 30440   NA  0.0002 1.00    NA    NA    NA     1.3 2.5e-02 0.00048    NA   NA

## BIC says 5 factors, so we'll go with that:
factorization <- fa(zeo, nfactors=5); factorization
# Standardized loadings (pattern matrix) based upon correlation matrix
#                  MR1   MR2   MR5   MR4   MR3   h2    u2 com
# ZQ              0.87 -0.14 -0.01  0.25 -0.04 0.99 0.013 1.2
# Total.Z         0.96  0.04 -0.01  0.07 -0.04 0.99 0.011 1.0
# Time.to.Z       0.05 -0.03  0.92  0.03  0.10 0.84 0.159 1.0
# Time.in.Wake   -0.18  0.90 -0.02  0.04 -0.15 0.83 0.168 1.1
# Time.in.REM     0.87  0.05  0.03  0.05  0.09 0.78 0.215 1.0
# Time.in.Light   0.94  0.02 -0.04 -0.20 -0.14 0.84 0.158 1.1
# Time.in.Deep    0.02  0.03  0.01  0.99 -0.02 0.98 0.023 1.0
# Awakenings      0.35  0.75  0.08 -0.03  0.26 0.79 0.209 1.7
# Start.of.Night -0.21  0.00  0.10 -0.05  0.86 0.84 0.162 1.2
# Morning.Feel    0.22 -0.13 -0.55  0.11  0.46 0.66 0.343 2.5
#
#                        MR1  MR2  MR5  MR4  MR3
# SS loadings           3.65 1.44 1.21 1.16 1.08
# Proportion Var        0.37 0.14 0.12 0.12 0.11
# Cumulative Var        0.37 0.51 0.63 0.75 0.85
# Proportion Explained  0.43 0.17 0.14 0.14 0.13
# Cumulative Proportion 0.43 0.60 0.74 0.87 1.00
#
#  With factor correlations of
#       MR1   MR2   MR5   MR4   MR3
# MR1  1.00  0.03 -0.18  0.34 -0.03
# MR2  0.03  1.00  0.27 -0.09  0.00
# MR5 -0.18  0.27  1.00 -0.09  0.09
# MR4  0.34 -0.09 -0.09  1.00  0.03
# MR3 -0.03  0.00  0.09  0.03  1.00
#
# Mean item complexity =  1.3
# Test of the hypothesis that 5 factors are sufficient.
#
# The degrees of freedom for the null model are  45  and the objective function was  40.02 with Chi Square of  48376
# The degrees of freedom for the model are 5  and the objective function was  32.69
#
# The root mean square of the residuals (RMSR) is  0.07
# The df corrected root mean square of the residuals is  0.2
#
# The harmonic number of observations is  1152 with the empirical chi square  473.1  with prob <  5.1e-100
# The total number of observations was  1214  with MLE Chi Square =  39412  with prob <  0
#
# Tucker Lewis Index of factoring reliability =  -6.359
# RMSEA index =  2.557  and the 90 % confidence intervals are  2.527 2.569
# BIC =  39377
# Fit based upon off diagonal values = 0.97
This looks like MR1=overall sleep; MR2=insomnia/bad-sleep; MR5=difficulty-falling-asleep?; MR4=deep-sleep-(not part of MR1!); MR3=dunno. MR1 and MR4 correlate 0.34, and MR2/MR5 0.27, which makes sense. I want to maximize overall sleep and deep sleep (deep sleep seems connected to health), so MR1 and M4.
Now that we have our factors, we can extract them and plot them over time for a graphical look:
MR1 <- predict(factorization, data=zeo)[,1]
MR4 <- predict(factorization, data=zeo)[,4]

par(mfrow=c(2,1), mar=c(4,4.5,1,1))
plot(MR1 ~ I(Start.of.Night/60), xlab="",        ylab="Total sleep (MR1)", data=zeo)
plot(MR4 ~ I(Start.of.Night/60), xlab="Bedtime", ylab="Deep sleep (MR4)",  data=zeo)
Total & deep sleep factors vs bedtime
looks like an overall linear decline (later=worse), but possibly with a peak somewhere looking like a quadratic.
So we’ll try fitting quadratics:
factorModel <- lm(cbind(MR1, MR4) ~ Start.of.Night + I(Start.of.Night^2), data=zeo); summary(factorModel)
# Coefficients:
#                      Estimate Std. Error t value Pr(>|t|)
# (Intercept)         -6.63e+01   7.65e+00   -8.67   <2e-16
# Start.of.Night       9.74e-02   1.07e-02    9.13   <2e-16
# I(Start.of.Night^2) -3.56e-05   3.72e-06   -9.57   <2e-16
#
# Residual standard error: 0.829 on 1127 degrees of freedom
#   (84 observations deleted due to missingness)
# Multiple R-squared:  0.152,   Adjusted R-squared:  0.15
# F-statistic:  101 on 2 and 1127 DF,  p-value: <2e-16
#
#
# Response MR4 :
#
# Call:
# lm(formula = MR4 ~ Start.of.Night + I(Start.of.Night^2), data = zeo)
#
# Residuals:
#    Min     1Q Median     3Q    Max
# -3.057 -0.651 -0.017  0.600  4.329
#
# Coefficients:
#                      Estimate Std. Error t value Pr(>|t|)
# (Intercept)         -5.06e+01   8.97e+00   -5.64  2.1e-08
# Start.of.Night       7.23e-02   1.25e-02    5.79  9.3e-09
# I(Start.of.Night^2) -2.58e-05   4.36e-06   -5.92  4.2e-09
#
# Residual standard error: 0.971 on 1127 degrees of freedom
#   (84 observations deleted due to missingness)
# Multiple R-squared:  0.0384,  Adjusted R-squared:  0.0367
# F-statistic: 22.5 on 2 and 1127 DF,  p-value: 2.57e-10

## on the other hand, if we had ignored the quadratic term, we'd
## get a much worse fit
summary(lm(cbind(MR1, MR4) ~ Start.of.Night, data=zeo))
# Coefficients:
#                 Estimate Std. Error t value Pr(>|t|)
# (Intercept)     6.643744   0.653047    10.2   <2e-16
# Start.of.Night -0.004613   0.000457   -10.1   <2e-16
#
# Residual standard error: 0.861 on 1128 degrees of freedom
#   (84 observations deleted due to missingness)
# Multiple R-squared:  0.0829,  Adjusted R-squared:  0.0821
# F-statistic:  102 on 1 and 1128 DF,  p-value: <2e-16
#
# Response MR4 :
#
# Coefficients:
#                 Estimate Std. Error t value Pr(>|t|)
# (Intercept)     2.337279   0.747401    3.13   0.0018
# Start.of.Night -0.001627   0.000523   -3.11   0.0019
#
# Residual standard error: 0.986 on 1128 degrees of freedom
#   (84 observations deleted due to missingness)
# Multiple R-squared:  0.00851, Adjusted R-squared:  0.00764
# F-statistic: 9.69 on 1 and 1128 DF,  p-value: 0.0019
So we want to use the quadratic. Given this quadratic model, what’s the optimal bedtime?
estimatedFactorValues <- predict(factorModel, newdata=data.frame(Start.of.Night=1:max(zeo$Start.of.Night, na.rm=TRUE)))
## when is MR1 maximized?
which(estimatedFactorValues[,1] == max(estimatedFactorValues[,1]))
# 1368
1368 / 60
# [1] 22.8
## 10:48 PM seems reasonable
## when is MR3 maximized?
which(estimatedFactorValues[,2] == max(estimatedFactorValues[,2]))
# 1401
## 11:21 PM seems reasonable

## summing the factors isn't quite the average of the two time, but it's close:
combinedFactorSums <- rowSums(estimatedFactorValues)
which(combinedFactorSums == max(combinedFactorSums))
# 1382
## 11:02PM
Maybe using factors wasn’t a good idea? We can try a multivariate regression on the variables directly:
quadraticModel <- lm(cbind(ZQ, Total.Z, Time.to.Z, Time.in.Wake, Time.in.REM,
                           Time.in.Light, Time.in.Deep, Awakenings, Morning.Feel)
                       ~ Start.of.Night + I(Start.of.Night^2), data=zeo)
summary(quadraticModel)
# Response ZQ :
#
# Coefficients:
#                      Estimate Std. Error t value Pr(>|t|)
# (Intercept)         -7.84e+02   1.06e+02   -7.38  3.1e-13
# Start.of.Night       1.29e+00   1.48e-01    8.68  < 2e-16
# I(Start.of.Night^2) -4.70e-04   5.16e-05   -9.10  < 2e-16
#
# Residual standard error: 11.5 on 1127 degrees of freedom
#   (84 observations deleted due to missingness)
# Multiple R-squared:  0.139,   Adjusted R-squared:  0.137
# F-statistic: 90.9 on 2 and 1127 DF,  p-value: <2e-16
#
# Response Total.Z :
#
# Coefficients:
#                      Estimate Std. Error t value Pr(>|t|)
# (Intercept)         -4.48e+03   5.54e+02   -8.08  1.7e-15
# Start.of.Night       7.32e+00   7.73e-01    9.47  < 2e-16
# I(Start.of.Night^2) -2.67e-03   2.69e-04   -9.91  < 2e-16
#
# Residual standard error: 60 on 1127 degrees of freedom
#   (84 observations deleted due to missingness)
# Multiple R-squared:  0.158,   Adjusted R-squared:  0.156
# F-statistic:  106 on 2 and 1127 DF,  p-value: <2e-16
#
# Response Time.to.Z :
#
# Coefficients:
#                      Estimate Std. Error t value Pr(>|t|)
# (Intercept)         -6.09e+02   1.22e+02   -4.98  7.3e-07
# Start.of.Night       8.43e-01   1.71e-01    4.94  8.8e-07
# I(Start.of.Night^2) -2.81e-04   5.95e-05   -4.73  2.6e-06
#
# Residual standard error: 13.2 on 1127 degrees of freedom
#   (84 observations deleted due to missingness)
# Multiple R-squared:  0.0431,  Adjusted R-squared:  0.0415
# F-statistic: 25.4 on 2 and 1127 DF,  p-value: 1.61e-11
#
# Response Time.in.Wake :
#
# Coefficients:
#                      Estimate Std. Error t value Pr(>|t|)
# (Intercept)         -1.26e+02   1.76e+02   -0.72     0.47
# Start.of.Night       2.15e-01   2.45e-01    0.88     0.38
# I(Start.of.Night^2) -7.83e-05   8.55e-05   -0.92     0.36
#
# Residual standard error: 19.1 on 1127 degrees of freedom
#   (84 observations deleted due to missingness)
# Multiple R-squared:  0.00149, Adjusted R-squared:  -0.000283
# F-statistic: 0.84 on 2 and 1127 DF,  p-value: 0.432
#
# Response Time.in.REM :
#
# Coefficients:
#                      Estimate Std. Error t value Pr(>|t|)
# (Intercept)         -1.43e+03   2.69e+02   -5.32  1.2e-07
# Start.of.Night       2.32e+00   3.75e-01    6.19  8.6e-10
# I(Start.of.Night^2) -8.39e-04   1.31e-04   -6.42  2.0e-10
#
# Residual standard error: 29.1 on 1127 degrees of freedom
#   (84 observations deleted due to missingness)
# Multiple R-squared:  0.0608,  Adjusted R-squared:  0.0592
# F-statistic: 36.5 on 2 and 1127 DF,  p-value: 4.37e-16
#
# Response Time.in.Light :
#
# Coefficients:
#                      Estimate Std. Error t value Pr(>|t|)
# (Intercept)         -2.45e+03   3.43e+02   -7.15  1.5e-12
# Start.of.Night       4.07e+00   4.78e-01    8.50  < 2e-16
# I(Start.of.Night^2) -1.50e-03   1.67e-04   -9.00  < 2e-16
#
# Residual standard error: 37.2 on 1127 degrees of freedom
#   (84 observations deleted due to missingness)
# Multiple R-squared:  0.164,   Adjusted R-squared:  0.162
# F-statistic:  110 on 2 and 1127 DF,  p-value: <2e-16
#
# Response Time.in.Deep :
#
# Coefficients:
#                      Estimate Std. Error t value Pr(>|t|)
# (Intercept)         -5.88e+02   1.10e+02   -5.34  1.1e-07
# Start.of.Night       9.27e-01   1.53e-01    6.04  2.1e-09
# I(Start.of.Night^2) -3.30e-04   5.35e-05   -6.17  9.5e-10
#
# Residual standard error: 11.9 on 1127 degrees of freedom
#   (84 observations deleted due to missingness)
# Multiple R-squared:  0.0398,  Adjusted R-squared:  0.0381
# F-statistic: 23.4 on 2 and 1127 DF,  p-value: 1.12e-10
#
# Response Awakenings :
#
# Coefficients:
#                      Estimate Std. Error t value Pr(>|t|)
# (Intercept)         -1.18e+02   2.71e+01   -4.36  1.4e-05
# Start.of.Night       1.68e-01   3.77e-02    4.46  9.0e-06
# I(Start.of.Night^2) -5.67e-05   1.32e-05   -4.31  1.7e-05
#
# Residual standard error: 2.93 on 1127 degrees of freedom
#   (84 observations deleted due to missingness)
# Multiple R-squared:  0.0274,  Adjusted R-squared:  0.0256
# F-statistic: 15.9 on 2 and 1127 DF,  p-value: 1.62e-07
#
# Response Morning.Feel :
#
# Coefficients:
#                      Estimate Std. Error t value Pr(>|t|)
# (Intercept)         -2.12e+01   7.02e+00   -3.01  0.00266
# Start.of.Night       3.32e-02   9.79e-03    3.39  0.00073
# I(Start.of.Night^2) -1.15e-05   3.41e-06   -3.37  0.00079
#
# Residual standard error: 0.761 on 1127 degrees of freedom
#   (84 observations deleted due to missingness)
# Multiple R-squared:  0.0103,  Adjusted R-squared:  0.0085
# F-statistic: 5.84 on 2 and 1127 DF,  p-value: 0.00301

## Likewise, what's the optimal predicted time?
estimatedValues <- predict(quadraticModel, newdata=data.frame(Start.of.Night=1:max(zeo$Start.of.Night, na.rm=TRUE)))
# but what time is best? we have so many choices of variable to optimize.
# Let's simply sum them all and say bigger is better
# first, we need to negate 'Time.in.Wake', 'Time.to.Z', 'Awakenings',
# as for those, bigger is worse
estimatedValues[,3] <- -estimatedValues[,3] # Time.to.Z
estimatedValues[,4] <- -estimatedValues[,4] # Time.in.Wake
estimatedValues[,8] <- -estimatedValues[,8] # Awakenings
combinedSums <- rowSums(estimatedValues)
which(combinedSums == max(combinedSums))
# 1362
Or 10:42PM, which is almost identical to the MR1 estimate. So just like before.
Both approaches suggest that I go to bed somewhat earlier than I do now. This has the same correlation ≠ causality issue as the rise-time analysis does (perhaps I am especially sleepy on the days I go to bed a bit early and so naturally sleep more), but on the other hand, it’s not suggesting I go to bed at 7PM or anything crazy, so I am more inclined to take a chance on it.
Rise Time for Productivity
I noticed a claim that for one person, rising at 3-5AM (!) seemed to improve their days “because the morning hours have no distractions” and I wondered whether there might be any such correlation for myself, so I took my usual MP daily self-rating and plotted against rise-time that day:

Self-rating vs rise time, n = 841
It looks like a cubic suggesting one peak around 8:30AM and then a later peak, but that’s based on so little I ignore it. The causal relationship is also unclear: maybe getting up earlier really does cause higher MP self-ratings, but perhaps on days I don’t feel like doing anything I am more likely to sleep in, or some other common cause. The available samples suggest that earlier than that is worse, possibly much worse, so I am not inclined to try out something I expect to make me miserable.
The source code of the graph & analysis; preprocessing:
mp <- read.csv("~/selfexperiment/mp.csv", colClasses=c("Date","integer"))
zeo <- read.csv("https://gwern.net/doc/zeo/gwern-zeodata.csv")
## we want the date of the day sleep ended, not started, so we ignore the usual 'Sleep.Date' and construct our own 'Date':
zeo$Date <- as.Date(sapply(strsplit(as.character(zeo$Rise.Time), " "), function(x) { x[1] }), format="%m/%d/%Y")
## convert "05/12/2014 06:45" to "06:45"
zeo$Rise.Time <- sapply(strsplit(as.character(zeo$Rise.Time), " "), function(x) { x[2] })
## convert "06:45" to the integer 24300
interval <- function(x) { if (!is.na(x)) { if (grepl(" s",x)) as.integer(sub(" s","",x))
                                           else { y <- unlist(strsplit(x, ":")); as.integer(y[[1]])*60 + as.integer(y[[2]]); }
                                         }
                          else NA
                        }
zeo$Rise.Time <- sapply(zeo$Rise.Time, interval)
## doesn't always work, so delete missing data:
zeo <- zeo[!is.na(zeo$Date),]

## correct for the switch to new unencrypted firmware in March 2013;
## I don't know why the new firmware changed things; adjustment of 226 minutes was estimated using:
# library(changepoint); cpt.mean(na.omit(zeo$Rise.Time)); '$mean [1] 566.7 340.2';  566.7 - 340.2 = 226
zeo[(zeo$Date >= as.Date("2013-03-11")),]$Rise.Time  <-
 (zeo[(zeo$Date >= as.Date("2013-03-11")),]$Rise.Time + 226) %% (24*60)

allData <- merge(mp,zeo)
morning <- data.frame(MP=allData$MP, Rise.Time=allData$Rise.Time)
morning$Rise.Time.Hour <- morning$Rise.Time / 60
write.csv(morning, file="morning.csv", row.names=FALSE)
Graphing and fitting:
morning <- read.csv("https://gwern.net/doc/zeo/2014-07-26-risetime-mp.csv")
library(ggplot2)
ggplot(data = morning, aes(x=Rise.Time.Hour, y=jitter(MP, factor=0.2)))
 + xlab("Wake time (24H)")
 + ylab("Mood/productivity self-rating (2/3/4)")
 + geom_point(size=I(4))
 ## cross-validation suggests 0.8397 but looks identical to auto-LOESS span choice
 + stat_smooth(span=0.8397)

## looks 100% like a cubic function
linear <- lm(MP ~ Rise.Time,         data=morning)
cubic  <- lm(MP ~ poly(Rise.Time,3), data=morning)
anova(linear,cubic)
# Model 1: MP ~ Rise.Time
# Model 2: MP ~ poly(Rise.Time, 3)
#   Res.Df RSS Df Sum of Sq    F Pr(>F)
# 1    839 442
# 2    837 437  2      5.36 5.14 0.0061
AIC(linear,cubic)
#        df  AIC
# linear  3 1852
# cubic   5 1846
summary(cubic)
# ...Coefficients:
#                     Estimate Std. Error t value Pr(>|t|)
# (Intercept)           3.0571     0.0249  122.70   <2e-16
# poly(Rise.Time, 3)1  -0.9627     0.7225   -1.33    0.183
# poly(Rise.Time, 3)2  -1.4818     0.7225   -2.05    0.041
# poly(Rise.Time, 3)3   1.7795     0.7225    2.46    0.014
#
# Residual standard error: 0.723 on 837 degrees of freedom
# Multiple R-squared:  0.0142,    Adjusted R-squared:  0.0107
# F-statistic: 4.02 on 3 and 837 DF,  p-value: 0.00749

# plot(morning$Rise.Time,morning$MP); points(morning$Rise.Time,fitted(cubic),pch=19)
which(fitted(cubic) == max(fitted(cubic))) / 60
#  516   631   762
# 8.60 10.52 12.70
Magnesium Citrate
Re-analyzing data from a magnesium self-experiment, I find both positive and negative effects of the magnesium on my sleep. It’s not clear what the net effect is.
I became interested in magnesium after noting a possible effect on my productivity from TruBrain (which among other things included a magnesium tablet), and then a clear correlation from some magnesium l-threonate. I’d also long heard of magnesium helping sleep, and was curious about that too. So I began a large (~207 days) RCT trying out 136mg then 800mg of elemental magnesium per day in late 201313ya—early 201412ya. (This was not a large enough experiment to definitively answer questions about both productivity and sleep, but since I have all the data on hand, I thought I’d look.)
The results of the main were surprising: it seemed that the magnesium caused an initial large boost to my productivity, but the boost began to fade and after 20 days or so, the effect became negative, and the period with the larger dose had a worse effect, suggesting a cumulative overdose.
With the differing effect of the doses in mind, I looked at the effect on my sleep data.
Analysis
Prep:
magnesium <- read.csv("https://gwern.net/doc/nootropic/quantified-self/2013-2014-magnesium.csv")
magnesium$Date <- as.Date(magnesium$Date)

zeo <- read.csv("https://gwern.net/doc/zeo/gwern-zeodata.csv")
zeo$Sleep.Date <- as.Date(zeo$Sleep.Date, format="%m/%d/%Y")
zeo$Date <- zeo$Sleep.Date
rm(zeo$Sleep.Date)
# create an equally-weighted index of bad sleep: a z-score of the 3 bad things
zeo$Disturbance <- scale(zeo$Time.to.Z) + scale(zeo$Awakenings) + scale(zeo$Time.in.Wake)

magnesiumSleep <- merge(zeo, magnesium)
write.csv(magnesiumSleep, file="2014-07-27-magnesium-sleep.csv", row.names=FALSE)
(I then hand-edited the CSV to delete unused columns.)
Graphing Disturbance:

Sleep disturbance over time, colored by magnesium dose, with LOESS-smoothed trend-lines
magnesiumSleep <- read.csv("https://gwern.net/doc/zeo/2014-07-27-magnesium-sleep.csv")
magnesiumSleep$Date <- as.Date(magnesiumSleep$Date)
## historical baseline:
magnesiumSleep[is.na(magnesiumSleep$Magnesium.citrate),]$Magnesium.citrate <- -1
library(ggplot2)
ggplot(data = magnesiumSleep, aes(x=Date, y=Disturbance, col=as.factor(magnesiumSleep$Magnesium.citrate))) +
 ylab("Disturbance z-score (lower=better)") +
 geom_point(size=I(4)) +
 stat_smooth() +
 scale_colour_manual(values=c("gray49", "grey35", "red1", "red2" ),
                     name = "Magnesium")
Analysis (first disturbances, then all variables):
magnesiumSleep <- read.csv("https://gwern.net/doc/zeo/2014-07-27-magnesium-sleep.csv")
l0 <- lm(Disturbance ~ as.factor(Magnesium.citrate), data=magnesiumSleep)
summary(l0)
# ...Coefficients:
#                                   Estimate Std. Error  t value  Pr(>|t|)
# (Intercept)                     -0.5020571  0.1862795 -2.69518 0.0076218
# as.factor(Magnesium.citrate)136 -0.0566556  0.3101388 -0.18268 0.8552318
# as.factor(Magnesium.citrate)800 -0.5394708  0.3259212 -1.65522 0.0994178
So it seems that magnesium citrate may decrease sleep problems.
l1 <- lm(cbind(ZQ, Total.Z, Time.to.Z, Time.in.Wake, Time.in.REM, Time.in.Light,
               Time.in.Deep, Awakenings, Morning.Feel)
               ~ as.factor(Magnesium.citrate),
         data=magnesiumSleep)
summary(l1)
# Response ZQ : ...Coefficients:
#                                 Estimate Std. Error  t value Pr(>|t|)
# (Intercept)                     95.85149    1.29336 74.11065  < 2e-16
# as.factor(Magnesium.citrate)136 -3.27254    2.15332 -1.51976  0.13012
# as.factor(Magnesium.citrate)800  1.49545    2.26290  0.66086  0.50945
#
# Response Total.Z : ...Coefficients:
#                                  Estimate Std. Error  t value Pr(>|t|)
# (Intercept)                     536.35644    6.59166 81.36898  < 2e-16
# as.factor(Magnesium.citrate)136 -27.37398   10.97453 -2.49432 0.013414
# as.factor(Magnesium.citrate)800  15.86805   11.53300  1.37588 0.170367
#
# Response Time.to.Z : ...Coefficients:
#                                 Estimate Std. Error  t value Pr(>|t|)
# (Intercept)                     12.59406    1.24108 10.14766  < 2e-16
# as.factor(Magnesium.citrate)136  4.26559    2.06629  2.06437 0.040247
# as.factor(Magnesium.citrate)800 -2.43079    2.17144 -1.11944 0.264269
#
# Response Time.in.Wake : ...Coefficients:
#                                 Estimate Std. Error  t value Pr(>|t|)
# (Intercept)                     24.09901    1.87720 12.83776  < 2e-16
# as.factor(Magnesium.citrate)136 -3.66041    3.12537 -1.17119  0.24289
# as.factor(Magnesium.citrate)800 -4.16023    3.28441 -1.26666  0.20672
#
# Response Time.in.REM : ...Coefficients:
#                                  Estimate Std. Error  t value Pr(>|t|)
# (Intercept)                     171.45545    2.99387 57.26889  < 2e-16
# as.factor(Magnesium.citrate)136  -6.45545    4.98452 -1.29510  0.19675
# as.factor(Magnesium.citrate)800   2.27925    5.23818  0.43512  0.66393
#
# Response Time.in.Light : ...Coefficients:
#                                  Estimate Std. Error  t value   Pr(>|t|)
# (Intercept)                     304.54455    4.08746 74.50709 < 2.22e-16
# as.factor(Magnesium.citrate)136 -23.33403    6.80525 -3.42883 0.00073338
# as.factor(Magnesium.citrate)800  20.51667    7.15156  2.86884 0.00455323
#
# Response Time.in.Deep : ...Coefficients:
#                                 Estimate Std. Error  t value Pr(>|t|)
# (Intercept)                     60.88119    1.20888 50.36152  < 2e-16
# as.factor(Magnesium.citrate)136  2.48723    2.01268  1.23578  0.21796
# as.factor(Magnesium.citrate)800 -6.81996    2.11510 -3.22441  0.00147
#
# Response Awakenings : ...Coefficients:
#                                  Estimate Std. Error  t value Pr(>|t|)
# (Intercept)                      6.039604   0.238675 25.30475  < 2e-16
# as.factor(Magnesium.citrate)136 -0.548376   0.397372 -1.38001  0.16910
# as.factor(Magnesium.citrate)800 -0.427359   0.417594 -1.02338  0.30734
#
# Response Morning.Feel : ...Coefficients:
#                                   Estimate Std. Error  t value Pr(>|t|)
# (Intercept)                      2.7227723  0.0762575 35.70497  < 2e-16
# as.factor(Magnesium.citrate)136  0.1193330  0.1269620  0.93991  0.34837
# as.factor(Magnesium.citrate)800 -0.1513437  0.1334229 -1.13432  0.25799
l2 <- lm(cbind(ZQ, Total.Z, Time.to.Z, Time.in.Wake, Time.in.REM, Time.in.Light,
               Time.in.Deep, Awakenings, Morning.Feel) ~ Magnesium.citrate,
         data=magnesiumSleep)
summary(manova(l1))
#                              Df    Pillai approx F num Df den Df     Pr(>F)
# as.factor(Magnesium.citrate)  2 0.3265357 4.271083     18    394 2.3902e-08
# Residuals                    204
summary(manova(l2))
#                              Df    Pillai approx F num Df den Df     Pr(>F)
# Magnesium.citrate            1 0.1815233  4.85456      9    197  7.1454e-06
# Residuals         205
which(p.adjust(c(0.3483,0.2579,0.1752,0.1301,0.5094,0.3344,0.0134,0.1703,0.0632,0.1967,
                 0.6639,0.4895,0.0007,0.0045,0.0005,0.2179,0.0014,0.0004,0.0402,0.2642,
                 0.1262,0.2428,0.2067,0.2673,0.1691,0.3073,0.4144),
               method="BH")
      < 0.05)
# [1] 13 14 15 17 18
A table summarizing the results by dose (‘all’ is the net effect from the non-factor version):
Variable |
Dose (mg) |
Coef |
p |
Effect |
|---|---|---|---|---|
|
136 |
0.11933 |
0.3483 |
better |
|
800 |
-0.15134 |
0.2579 |
worse |
|
all |
-0.00022 |
0.1752 |
worse |
|
136 |
-3.27254 |
0.1301 |
worse |
|
800 |
1.49545 |
0.5094 |
better |
|
all |
0.00270 |
0.3344 |
better |
|
136 |
-27.3739 |
0.0134 |
worse |
|
800 |
15.8680 |
0.1703 |
better |
|
all |
0.02698 |
0.0632 |
better |
|
136 |
-6.45545 |
0.1967 |
worse |
|
800 |
2.27925 |
0.6639 |
better |
|
all |
0.00447 |
0.4895 |
better |
|
136 |
-23.3340 |
0.0007 |
worse |
|
800 |
20.5166 |
0.0045 |
better |
|
all |
0.03202 |
0.0005 |
better |
|
136 |
2.48723 |
0.2179 |
better |
|
800 |
-6.81996 |
0.0014 |
worse |
|
all |
-0.00939 |
0.0004 |
worse |
|
136 |
4.26559 |
0.0402 |
worse |
|
800 |
-2.43079 |
0.2642 |
better |
|
all |
-0.00415 |
0.1262 |
better |
|
136 |
-3.66041 |
0.2428 |
better |
|
800 |
-4.16023 |
0.2067 |
better |
|
all |
-0.00449 |
0.2673 |
better |
|
136 |
-0.54837 |
0.1691 |
better |
|
800 |
-0.42735 |
0.3073 |
better |
|
all |
-0.00042 |
0.4144 |
better |
For the low dose, 4⁄9 were better; for the high dose, 7⁄9 were better. Adjusting for multiple-comparison at p < 0.05: the surviving effects are:
Variable |
Dose (mg) |
Coef |
p |
Effect |
|---|---|---|---|---|
|
136 |
-23.3340 |
0.0007 |
worse |
|
800 |
20.5166 |
0.0045 |
better |
|
all |
0.03202 |
0.0005 |
better |
|
800 |
-6.81996 |
0.0014 |
worse |
|
all |
-0.00939 |
0.0004 |
worse |
Redshift/f.lux
Lithium
ZMA
Hammock
Ever since I was a little kid watching Gilligan’s Island on Nick at Nite & then TV Land, I had one burning question about the antics of the cast and their island idyll/prison: what was it like to sleep in a hammock, anyway‽ Skipper and Gilligan slept in hammocks all the time, but the show stubbornly refused to go into any details about the nature of hammock sleeping. Was it better than beds? Worse? Hotter? Colder? Did it hurt the neck?
While my beds usually are good as far as beds go, I’ve never been completely happy with them: as a side sleeper, it’s all too easy for me to wake up with a paralyzed arm or a crick in the neck. (It is irritating to sound like a sheet of bubble-wrap in the morning.) And anytime I have to move a bed, I can’t help wondering if beds really have to be as bulky and heavy as they are. But it seemed to me that a hammock, enfurling & enclosing one as they do, might resolve that problem. What does the scientific literature say about this? The topic seems to be almost completely unresearched. For example, almost every hit for the word “hammock” on Pubmed is due to the author B.D. Hammock. Google Scholar does a little bit better, as the first few pages of hits, besides turning up B.D. Hammock again, points at a short experiment “Rocking synchronizes brain waves during a short nap” which compared 12 men napping on a swaying bed, and suggests some literature on the effect of spinal angle on sleep. This silence is a little surprising, consider that a nontrivial fraction of humanity sleeps in hammocks or hammock-like things—you’d think navies, at the very least, would be interested in the subject of whether hammocks were better than beds—but so it goes.
The questions, at irregular intervals over the years, continued to prey on my mind, occasionally prompted by mention of sailors. Of course I periodically would run into lawn/garden hammocks, but those wretched contraptions were no answer: the cord made for an uncomfortable rest, and the enormous spreader bars lead to severe instability (although they made for great pranks). Finally in 201412ya, it dawned on me that I had access to an unused stand for a lawn hammock; I had room to set it up in my bedroom; and from idly browsing Amazon, I knew I could get a hammock for under $73.95$502014, which seemed reasonable for an experiment. Why cunctate and repine further? I couldn’t think of any reason why not, so after some more browsing, the cheapest hammock seemed to be the Army Green Ultra Light Hammocks with Tree Strap for $33.28$22.52014, and I ordered it in September.
I was a little surprised how small and lightweight the hunter-green nylon hammock turns out to be (the whole package fits in a padded envelope mailer and weighs under a pound), and quickly set it up.
The frame creaked alarmingly under my 200 pounds, but it held up. It feels very different from a bed, more like a slide at an amusement park in how one is laying back into a tube. Laying in a hammock is also much more stable than a lawn hammock, at least once you get into it successfully. Another issue was the gradual discomfort of having my feet elevated due to the V-shape of the hammock as it sagged under my weight. This seemed mostly resolved by tightening the ropes and laying at more of a diagonal.
I found it easy to take a brief nap or rest in it, but it felt like it was squeezing my shoulders into my chest and my first attempt to sleep overnight failed. The second & third nights went better, but still not as good as the bed.
The problem seems to be the arms/chest squeezing, caused by nothing ‘pushing apart’ the two walls of the hammock at the top. The Wikipedia article on hammocks mentions sailors using a “spreader bar”, which sounds like a solution to my problem. So I need to find a piece of wood and tweak it into a suitable form, while avoiding any sharp corners which might cut the nylon material of the hammock.
My first approach was to take a short narrow plank about the width of my shoulders and saw V-shaped notches in each end, then bevel and sand the edges of the notches so they wouldn’t fray the nylon cords. This was easy enough, and then one simply sticks it in between the two cords on one end. It turns out that the plank slips out very easily, and the pressure causes it to slide up halfway to form a diamond configuration, which doesn’t accomplish the goal of spreading the hammock, since the hammock is still dangling from a point where one wants a perpendicular line. I could force it down the strings towards the end of the hammock, spreading out the hammock, but the instant any pressure was placed on the system (such as by getting in), the plank would either collapse or revert to a diamond+point.
So if it kept slipping, I’d force it to stay. This time, I drilled two holes through opposite ends of the plan, fed the two ends of the nylon cord through the two holes, drew the cord as tight as possible, then put a knot behind/above each hole in the plank. Now they couldn’t slip because the knots would not pass through the drilled holes, and I had left no slack, so when weight was put, a point was not formed but more of a triangle. (I did wind up adding extra knots as slack slowly grew.)
That worked. Now I could lie back and my chest was not being compressed. Combined with an intermediate looseness of hang (it turns out tighter is not always better once the squeeze problem is resolved and you’re sleeping slightly diagonally), the hammock was now very pleasant for napping, and pretty good for sleeping.
I gave sleeping in hammock a few more nights of trying, and ran into a new problem: the same feature that makes hammocks so good for hot climates also makes them problematic in the winter, ie you’re exposed to the air. The chill woke me up early in the morning twice, even after I added in a fuzzy blanket to sleep on top of. Probably I could fix this by adding a thicker blanket underneath, but I decided to pack up the hammock (which takes very little space) and retry again in spring when my room starts getting warm again.
In May 201511ya, after it became warm enough again that I needed air conditioning on at night, I set the hammock back up and gave it another try. After 3 failed nights, I gave up: the coldness was great, but no position or tension seemed to give my shoulders enough room to move and let me roll over. I concluded that I’m too used to sleeping in a bed to adapt to a hammock in the absence of tropical incentives.
So I moved the hammock outside—whatever its problems for sleeping in, it’s great for napping and infinitely more comfortable than the common rope lawn hammock.
A partial solution to the cold is foam earplugs; another interesting possibility is a bamboo wife, a hollow pillow or framework which reduces the need for a thick blanket/pillow to clutch and support one while laying on one’s side. (I don’t know what to do about the neck issues. Probably just put up with it as I always have.) The hollow kind don’t seem easily available without ordering from sketchy sites, so I took an old comforter blanket, rolled it up roughly the width of my stomach to my chin, and tied it tightly into a bundle with nylon line, which works for now.
In Progress
Someone suggested that instead of running experiments serially, with limited sample sizes (because I am impatient to try the next interesting suggestion), I could instead take a step up in statistical sophistication and use a factorial experiment design: use multiple experimental interventions simultaneously for a much larger sample size, and then run ANOVA analyses rather than simpler two-sample t-tests. No less than R. A. Fisher praises multifactorial experiments as being more efficient: squeezing more data out of a given sample. Hence, I thought a crazy thought: my lithium experiment was going to run for ~360 days, and so I kept putting it off. But what if I ran multiple experiments for 360 days? If I had 4 or 5, then by the end of the year, I would have 5 results to show, and I would have the statistical equivalent of more than n = 72 (360⁄5) for each experiment. Win-win.
Classic multifactorial designs arrange to have every possible combination of the n experiments happen on some day or other (such an arrangement is called a Latin square). However, with 5 experiments, each of which has 2 states (on and off), that means I only have 25=32 possible arrangements, all of which ought to be covered over 360 days, terminating in March 201313ya. (It actually will take much longer, as I paused the lithium sub-experiment for several months to run another experiment.) So I will be lazy and will independently randomize each experiment.
As it wound up, I had bitten off too much in trying to run interconnected experiments: while the Redshift experiment ran without too much problem, an unexpected and abrupt move in July 201214ya completely disrupted my daily routine and I was unable to maintain my habit of randomizing my meditation sessions. So I will be analyzing the experiments separately.
Push-Ups
Rather than dumbbells (might be hard to find in the dark), I decided to try out push-ups since I routinely do 25 push-ups after showering and it ought to be mentally easy to shift those push-ups to before/after bedtime. As before, alternate-day, but with a twist: on-days, I do the push-ups immediately before going to bed, but off-days entail immediately upon awakening. (I don’t exercise enough in general.) I began 2011-09-21.
I interrupted the experiment for a long period to run the vitamin D experiments; when I resumed on 2012-05-08, I decided to avoid the alternate-day procedure and instead randomize morning vs evening push ups with a coin. Non-blinded.
On 2012-11-13, I decided I was sufficiently convinced that exercise immediately before bed was damaging my sleep latency that I didn’t want to continue to pay the price of worse sleep, and I discontinued this variable. Hopefully the previous data will be sufficient to confirm or disconfirm any effect.
Meditation
The practice of meditation can be time-intensive; a claimed anecdotal benefit is that one sleeps less and so the time requirement isn’t as bad as it may seem.
Meditation has been linked with sleep changes multiple times; see “Meditation and Its Regulatory Role on Sleep”. In particular, “Meditation acutely improves psychomotor vigilance, and may decrease sleep need” found a correlation between long meditation and reduced sleep need. The general link seems plausible—that deliberate relaxation may reduce the need for another kind of relaxation (although I doubt meditation is going as far as reducing synaptic weights as the “synaptic homeostasis” hypothesis predicts which I discuss in Algernon’s Principle)—but I can think of at least 2 plausible ways the correlation would not be causation (1. those with less sleep need can afford to spend time on meditation; 2. meditation is partially sleep so there’s no correlation or causation to explain).
Randomized on a daily basis: either 20-3015 minutes of meditation or none. (I am not sure what a good placebo would be so I will omit it.) Non-blinded. My meditation is nothing fancy: simple breath-following (based on early chapters of Mindfulness in Plain English).
Plausibly, any decrease in sleep need could be due to long-term changes in the brain itself, as meditation is known to affect areas like the prefrontal cortex. Kaul et al 201016ya above did not randomize the long-term meditators’ use of meditation or apparently investigate whether sleep time averages correlated with meditation. If the changes are long-term, then there will be relatively little variation during the 360 days and instead a gradual trend of less sleep. If no clear effect shows up in the analysis, I’ll try a before-after comparison: compare n days before the experiment started to n days after the experiment and see if there is a difference in the averages.
Power Calculation
Kaul et al 201016ya describes the long-term meditators as spending “2–3 hours/day” in meditation. (Their experiment used novices who meditated for 1 hour.) If meditation indeed reduces sleep time, but I am meditating for only 1⁄3 an hour, can I detect any effect?
The difference between the long-term meditators and their normal Indian counterparts was 5.2 hours of sleep per day versus 7.8. Assume the worst case of 3 hours, this implies that meditation is indeed a net cost in time (8.2 > 7.8), but also that each hour of meditation is equivalent to almost an hour of sleep ((7.8 − 5.2) / 3 = 0.866…). So at that conversion rate, 20 minutes of meditation translates to 17.32 minutes less sleep. We will steal code and data from the previous Redshift power calculation: assume the same control sleep, same standard deviation, and subtract 17.32 from the control to get the true mean of the intervention
# install.packages("pwr")
library(pwr)
pwr.t.test(d=(456.4783 - (456.4783 - 17.32))/131.4656,power=0.5,type="paired",alternative="greater")

     Paired t test power calculation
              n = 157.237

# we're getting 360 days or 180 pairs; let's ask for more than 50-50 power;
# what does n = 180 buy us? Not much!
pwr.t.test(d=(456.4783 - (456.4783 - 17.32))/131.4656,power=0.55,type="paired",alternative="greater")

     Paired t test power calculation

              n = 181.9631

# how many pairs *do* we need for good results?
pwr.t.test(d=(456.4783 - (456.4783 - 17.32))/131.4656,power=0.75,
  sig.level=0.01,type="paired",alternative="greater")

     Paired t test power calculation
              n = 521.5252

pwr.t.test(d=(456.4783 - (456.4783 - 17.32))/131.4656,power=0.56
 sig.level=0.01,type="paired",alternative="greater")

     Paired t test power calculation
              n = 356.2923
This is discouraging. With 180 pairs, we only have a 55% chance of seeing anything at p = 0.05? That’s awful! But there’s no point in looking further into this power calculation: I’m not going to be doing a paired t-test, after all, but some sort of ANOVA, and I’m not sure how much power the interfering experiments cost me. The first calculation is the most important: to satisfy somewhat reasonable criteria, I need less than half the data I will get, which ought to be an adequate margin of safety.
VoI
For background on “value of information” calculations, see the first calculation.
I find meditation useful when I am screwing around and can’t focus on anything, but I don’t meditate as much as I might because I lose half an hour. Hence, I am interested in the suggestion that meditation may not be as expensive as it seems because it reduces sleep need to some degree: if for every two minutes I meditate, I need one less minute of sleep, that halves the time cost—I spend 30 minutes meditating, gain back 15 minutes from sleep, for a net time loss of 15 minutes. So if I meditate regularly but there is no substitution, I lose out on 15 minutes a day. Figure I skip every 2 days, that’s a total lost time of 15 × 2⁄3 × 365.25 ⧸ 60 = 61 hours a year or $631.5$4272014 at minimum wage. I find the theory somewhat plausible (60%), and my year-long experiment has roughly a 55% chance of detecting the effect size (estimated based on the sleep reduction in a Indian sample of meditators). So (427 − 0) ⧸ log 1.05 × 0.60 × 0.55 = 2,888. The experiment itself is unusually time-intensive, since it involve ~180 sessions of meditation, which if I am “overpaying” translates to 45 hours ((180 × 15)⧸60) of wasted time or $465.86$3152014. But even including the design and analysis, that’s less than the calculated value of information.
This example demonstrates that drugs aren’t the only expensive things for which you should do extensive testing.
Masturbation
Orgasm has been linked occasionally with changes in sleep latency, although one 198541ya experimental study found no changes. Schenck et al 2007 covers some inconclusive followup studies on related matters like whether arousal or brief viewing of porn interferes with sleep (no).
Randomized on a daily basis before going to bed; no placebo, but abstinence. Non-blinded. Since the theory has always been about a very short-term effect, there’s no need to worry about daytime activities. (This would only matter if I were testing something like the folk wisdom that masturbation reduces testosterone levels, where the timing is not as important as the quantity.)
Treadmill / Walking Desk
In June 201214ya, I acquire a free treadmill. I became interested in using it as a treadmill desk, reasoning that it was an easy way to get more exercise. My initial days of use led me to suspect that the treadmill desk’s exercise might come at the expense of some concentration or productivity. While I was able to quickly rule out any noticeable negative correlation of treadmill use with typing speed/accuracy, that still leaves other possible negative effects.
Power
Starting it part way, I lose potential power: there are only ~330 days left. The effect of most interest is productivity, where I expect a negative effect, but we also need a more stringent p-value since we’re looking at so many variables; so 330 samples gives a floor on detectable effect size of
pwr.t.test(n=(330/2),power=0.75,sig.level=0.01,type="paired",alternative="less")

     Paired t test power calculation

              n = 165
              d = -0.2355713
Not that great. We may wind up being able to conclude little about the effect on productivity; similarly for sleep—the effect would have to be comparable to vitamin D or melatonin to be detectable.
VoI
The VoI calculation for this investigation is very difficult: it may improve sleep and it may improve or worsen productivity but regardless is good for very valuable exercise, scrapping the practice has immediate cash value, but none of this is certain and there are few guides from experimental studies.
If it turns out the treadmill is not helpful, I can probably sell it for ~$138.46$1002016 based on prices listed in Craigslist. (I wound up selling it for $96.92$702016.) If it’s helpful, I gain considerable exercise (1MPH implies an 8-hour day could be 8 miles of exercise a day!) with the related benefits. I strongly suspect that this much exercise would influence my sleep for the better, but I’m not sure the treadmill desk really does allow for productivity like regular sitting does. If it does reduce productivity somewhat but I otherwise can adapt, it’s probably still a net gain because of the extra exercise. However, a small-to-medium decrease—let’s say an effect size of d ≤ -0.4—would be enough to cause me to scrap the treadmill. This is highly unlikely. The large sample gives a very good shot at detecting it. Running the experiment is relatively easy since the treadmill desk can be set up and put away in ~5 minutes. Without running numbers on this one, my best guess is that the VoI is negative; so this is another experiment I am doing because it is interesting and other people may find it interesting, rather than because running the experiment makes economic sense.
Morning Caffeine Pills
CO2/Bedroom Ventilation Experiment
External Links
Discussion:
coping with Zeo Inc’s shutdown:
“The Effects of Caffeine, Alcohol, and Exercise on Sleep: Analyzing the Surprising Results”
Appendix
Inverse Correlation of Sleep Quality With Productivity?
Curiously, playing around with the full potassium data after the 201313ya morning experiment, poor sleep quality seemed to correlate with higher mood/productivity ratings.
cor.test(pot$Disturbance, pot$MP)
#     Pearson`s product-moment correlation
#
# data:  pot$Disturbance and pot$MP
# t = 1.224, df = 49, p-value = 0.2269
# alternative hypothesis: true correlation is not equal to 0
# 95% confidence interval:
#  -0.1085  0.4275
# sample estimates:
#    cor
# 0.1722
Hypotheses
While not statistically-significant, this inverse correlation comes as a surprise and I thought worth thinking about more. I have a couple theories on what could be going on:
it could be an artifact and actually better sleep means better performance: I’ve always been concerned about the possibility of off-by-one errors in my data or analyses. If better sleep meant better performance (as one would naively suspect), and either sleep data or performance data was ‘shifted’ by one day, then you would observe the exact opposite.
One would have to carefully check the data and make sure every field is referring to the time it should. If an entry records 10hrs sleep for 2012-02-03, does that refer to sleep that morning which is necessary because you were awake during 2012-02-02, or does it refer to the sleep you engage in that evening (you go to bed at 11pm 2012-02-03 and that is the sleep data being used).
This seems unlikely, since such an error should screw up all sorts of other analyses (for example such a flip ought to have claimed that potassium would help sleep, if days were being reversed).
it could be that on productive days, you leap out of bed; but if you are depressed, unmotivated, apathetic, you might hang around in bed for a while after the alarm rings. Depressed people sometimes sleep more than regular people; for pretty much this reason, I’d guess.
This could be checked by looking at sleep quality indicators in the beginning or middle of the night. For example time to fall asleep (higher on more productive days in this sample), or percentage in deep sleep (mostly done towards the beginning and middle of a sleep; seemed to be lower for productive days). One could try to test the sluggard hypothesis: how much past an alarm one snoozed.
it’s a temporary correlation of this time period, perhaps related to the potassium, perhaps not.
This is testable: with more data, does the correlation shrink or go away?
I have sometimes wondered if I am depressed. One of the curious facts about depression is that sleep deprivation can temporarily relieve the symptoms of depression in people who prefer evenings (owls), and I am indeed an owl. What does this imply?
We can do some back-of-the-envelope estimates. Wikipedia reports a very high depression incidence; we’ll call it a 25% lifetime risk. But presumably the treatment only works if one is actually in a depressive episode, and while it’s unclear what the distribution or length of depression period (as opposed to individual episodes) might be, it seems to be closer to years than months or decades, so we’ll put it at ~3 years out of an adult lifespan of ~60 years or a per-year risk of 1⁄20 = 0.05. On closer examination of Selvi et al 200620ya, the morning/evening split only appears with the total sleep deprivation procedure (morning types see their mood worsen, evening sees it improve) while with partial sleep deprivation both groups seem to see an improvement in their mood; since I rarely skip sleep entirely and such nights are dropped from the Zeo data, the total sleep deprivation results are irrelevant, but then my chronotype being evening doesn’t matter. Finally, the sleep deprivation papers estimate <60% effectiveness in the depressed, so that knocks the possibility that both I am depressed and partial sleep deprivation helps me to <0.025. 2.5% is not a large possibility; and my vague speculation and a small inverse correlation do not seem like they would increase that possibility a lot.
(If it’s not these, I don’t have any suggestion on why it might be. Why would poor sleep either cause productivity or be caused by something that later also causes productivity?)
Analysis
But before rashly assuming I am depressive or engaging in personally costly self-experiments like sleep deprivation, I decided on 2013-04-26 to check the correlation on a larger dataset.
Typing up my full self-rating dataset of 416 days and cleaning up all the data16, I rechecked the correlation: r = 0.06617 This is noticeably smaller (hence, less practically relevant) than the previous correlation, is also not statistically-significant, and shrinking is what one would expect from a spurious relationship.
To be more sure, I reused some of the techniques from my analysis of the effect of weather on my mood/productivity (specifically, ordinal logistic regression) and looked for a relationship; the result was similar, an odds which was inverse but close to no effect (1.05718). More importantly, when all the other variables are taken into account in the logistic regression, things change19: with other data to condition on, the inverse relationship of sleep quality with mood/productivity reverses and becomes the expected relationship (an increase in sleep disturbances predicts lower mood/productivity); many of the other variables turn out to be far stronger predictors (bigger odds); and some of the signs look odd (how can total sleep time predict increased mood/productivity, yet increasing all forms of sleep—REM/light/deep—predicts decreased mood/productivity‽). I attempted to construct a simpler model, which wound up ignoring any metric of sleep disturbance and ignoring all but 3 variables, and concluding that “Morning Feel” was the most important predictor20—which makes a lot of sense to me, and confirms my previous experiments’ focusing on the “Morning Feel” variable.
Given this weakening and in the absence of any corroborating information, I consider it highly unlikely that the original correlation is reflecting an anti-depressant effect due to sleep deprivation. A followup in a few years may be warranted to see if a larger still dataset will shrink the correlation closer to zero.
Phases Of The Moon
SDr Lucid Dreaming: Exploratory Data Analysis
In October 201214ya, an acquaintance offered me an extract from his free-form data on lucid dreaming which he had been compiling since 200422ya, to see what insights I could extract. In May 201313ya, he augmented it with another 60 entries.
Data Cleaning
The original text was a serious mess, and I put several hours into cleaning it up and organizing it into something more sensible. This wasn’t enough, so I wrote an ugly Haskell program to parse it into a quasi-CSV file:
import Data.List (isInfixOf, isPrefixOf, intercalate)
import Data.List.Split (splitOn) -- https://hackage.haskell.org/package/split

main :: IO ()
main = do txt <- readFile "2012-sdr-dream.txt"
          let txt' = filter (not . isPrefixOf "#") $ lines txt
          let header = drop 2 $ head $ filter (isPrefixOf "# Sleep Date,") $ lines txt
          let fields = map (splitOn ",") txt'
          let csvs = map convert fields
          putStrLn $ unlines (header : map show csvs)

data CSVEntry = CSVEntry { sleepDate :: String, totalZ :: Int,
                           wakeTime :: String, intensity :: String, recall :: String,
                           emotion :: String, interrupted :: Bool, melatonin :: Bool, lucid :: String }
instance Show CSVEntry where
 show a = intercalate "," [sleepDate a, if totalZ a == 0 then "" else show (totalZ a),
                           wakeTime a, intensity a, recall a, emotion a,
                           if interrupted a then "1" else "0", if melatonin a then "1" else "0", lucid a]

convert :: [String] -> CSVEntry
convert xs = CSVEntry { sleepDate = safeHead $ filter (\x -> isInfixOf "." x || isInfixOf "20" x) xs,
                        totalZ = timeToMinutes $ drop 12 $ safeHead $ filter (isInfixOf "dreamtime: ") xs,
                        wakeTime = drop 7 $ safeHead $ filter (isInfixOf "wake: ") xs,
                        intensity = drop 6 $ safeHead $ filter (isInfixOf "int: ") xs,
                        recall = drop 9 $ safeHead $ filter (isInfixOf "recall: ") xs,
                        emotion = drop 6 $ safeHead $ filter (isInfixOf "emo: ") xs,
                        lucid =  drop 8 $ safeHead $ filter (isInfixOf "lucid: ") xs,
                        interrupted = any (isInfixOf "interrupted") xs,
                        melatonin = any (isInfixOf "melatonin") xs }
                        where
                                safeHead :: [String] -> String
                                safeHead ys = if null ys then "" else head ys

                                -- clock hour:minute to total minutes: timeToMinutes "4:30" → 270
                                timeToMinutes :: String -> Int
                                timeToMinutes a = if null a then 0 else let (x,y) = break (==':') a
                                                     in read x * 60 + read (tail y)
Analysis
This was usable. My next question was: since none of his routines were randomized and correlations were all that one could extract, what correlations were in his data?
table <- read.csv("https://gwern.net/doc/zeo/2013-sdr-dream.csv")
summary(table)
#       Sleep.Date     Total.Z        Wake.Time     Intensity        Recall         Emotion
#  2011.10.02:  2   Min.   : 120           :217   Min.   :0.10   Min.   :0.000   Min.   :-0.50
#  2011.11.26:  2   1st Qu.: 480   16:00   :  3   1st Qu.:0.30   1st Qu.:0.200   1st Qu.: 0.00
#  2012.02.28:  2   Median : 600   11:00   :  2   Median :0.40   Median :0.300   Median : 0.20
#  2012.04.15:  2   Mean   : 613   13:23:00:  2   Mean   :0.44   Mean   :0.367   Mean   : 0.18
#  2012.06.21:  2   3rd Qu.: 720   19:17:00:  2   3rd Qu.:0.50   3rd Qu.:0.500   3rd Qu.: 0.40
#  2013.01.23:  2   Max.   :1320   4:55:00 :  2   Max.   :7.00   Max.   :1.000   Max.   : 0.70
#  (Other)   :316   NA's   :8      (Other) :100   NA's   :94     NA's   :26      NA's   :296
#   Interrupted     Melatonin          Lucid      Day.quality
#  Min.   :0.00   Min.   :0.0000   Min.   :0.0   Min.   :0.10
#  1st Qu.:0.00   1st Qu.:0.0000   1st Qu.:0.1   1st Qu.:0.30
#  Median :0.00   Median :0.0000   Median :0.2   Median :0.40
#  Mean   :0.07   Mean   :0.0762   Mean   :0.2   Mean   :0.42
#  3rd Qu.:0.00   3rd Qu.:0.0000   3rd Qu.:0.2   3rd Qu.:0.52
#  Max.   :1.00   Max.   :1.0000   Max.   :0.6   Max.   :0.70
#  NA's   :76                      NA's   :319   NA's   :312

## These 2 date fields haven't been turned into anything useful, so we'll just delete them:
rm(table$Wake.Time, table$Sleep.Date)

## Warning: 'Lucid' has just 9 datapoints, and 'Melatonin' just 6!
## Table cleaned up heavily by hand from default R output:
## deleted duplicates, censored any tiny correlation −0.1 < x < 0.1 etc.
cor(table,use="pairwise.complete.obs")
#              Recall  Emotion Interrupted Melatonin  Lucid  Day.quality
# Total.Z                                    -0.12    -0.43  0.56
# Intensity    0.35     0.37                           0.79
# Recall                0.16      -0.16       0.14    -0.15
# Emotion                          0.28      -0.14
# Interrupted                                          0.91
# Melatonin                                                  0.25
Much of the data is too impoverished to draw any suggestions from. The remaining correlations are:
‘Intensity’/‘Recall’: r = 0.35
The causality is likely ‘Intensity’->‘Recall’; either one is probably impossible to experimentally manipulate.
‘Intensity’/‘Emotion’: r = 0.37
Causality could go either way or to a third factor; ‘Emotion’ might be manipulable by intending to dream of disturbing topics, but might not.
‘Interrupted’/‘Recall’: r=-0.16
‘Interrupted’/‘Emotion’: r = 0.28
‘Interruption’ is experimentally manipulable by eg. an alarm clock or roommate. ‘Recall’ might be improved by some change in journaling, for example doing at your bed instead of waiting until you’re on your computer. The positive correlation with ‘Emotion’ suggests that, per the WILD methodology of lucid dreaming (see LaBerge & Rheingold, Exploring the World of Lucid Dreaming), a temporary awakening does increase the chance of a lucid dream (laden with emotion).
‘Melatonin’ interestingly correlates with both day quality and with reduced sleep; this is interesting because
Total.Zincreasing also increasedDay.qualityso it’s not clear how melatonin could do both at the same time if more sleep is otherwise better. The correlations may be statistically-significant but the data is too wretched and the melatonin/day-quality variables too few to say anything further.
(One observation that came to mind working on cleaning the data was that collection was very sparse, sporadic, and accidental-looking.)
So these general points suggest 3 future overlapping approaches:
deliberate use of interruptions (maybe randomized), to investigate effect on lucid dreaming
more systematic usage (perhaps randomized or blinded) of melatonin, to allow correlations or causal inferences to other variables
attacking the unsystematic data collection (perhaps it’s too much trouble to do all those variables each day?) by getting a Zeo to handle part of the data collection for you.
Relevant papers:
These seem to be based on the same experiment:
“Evaluation of a Portable, Dry Sensor-Based Automatic Sleep Monitoring System”, Wright & Johnstone & Fabregas & Shambroom 200818ya (poster)
“Assessment of Dry Headband Technology for Automatic Sleep Monitoring”, Wright & Johnstone & Fabregas & Shambroom 200818ya (poster)
“Performance of a Wireless Dry Sensor System in Automatically Monitoring Sleep and Wakefulness”, Fabregas & Johnstone & Shambroom 200917ya (poster)
“Evaluation of Portable Monitor for Sleep Staging”, Shambroom & Johnstone & Fabregas 200917ya (abstract)
“Assessment of a wireless dry sensor to detect sleep in healthy volunteers and subjects with sleep disorders”, Blake et al 200917ya (abstract)
“Zeo Home Use Test Mid-Term Response: A Zeo White Paper”, Shambroom 200917ya (Zeo user survey)
“Validation of an automated wireless system to monitor sleep in healthy adults”, Shambroom et al 2012
“Recent Developments in Home Sleep-Monitoring Devices”, Kelly et al 201214ya (review of research on Zeo & other devices)
“Polysomnographic validation of a wireless dry headband technology for sleep monitoring in healthy young adults”, Tonetti et al 2013
“Assessment of a wireless headband for automatic sleep scoring”, Griessenberger et al 2013
“Validation of an Automated Wireless System for Sleep Monitoring During Daytime Naps”, Cellini et al 2014
“Alternatives to polysomnography (PSG): A validation of wrist actigraphy and a partial-PSG system”, Kosmadopoulos et al 2014
Also relevant: “Comparing 10 Sleep Trackers (2017): How well do they track your sleep? A 9-day minute-by-minute comparison”.↩︎
The cheaper alternative to the Zeo would be the Fitbit, the most popular of the many accelerometers on the market. There aren’t many comparisons; Diana Sherman compared one night, Joe Betts-LaCroix compared ~38 nights of data, and Christopher Winter compared one night of polysomnography, Philips Actiwatch Spectrum (actigraphy), Basis Chrome (movement, heart-rate, others), and the Jawbone Up & FitBit Flex & iPhone+“24/7” (actigraphy). In the previous cases, the Fitbit seemed to be pretty similar to the Zeo at estimating total sleep time (the only thing it can measure). Betts-LaCroix explicitly recommends the Zeo, but I’m not clear on whether that is due to the better data quality or because Fitbit made it hard to impossible for him to extract the detailed Fitbit data while Zeo offers easy exporting. Similarly, in her 2013 Amsterdam talk, Christel De Maeyer presents her sleep data summaries (means) from two disjoint time periods using the Zeo and the BodyMedia accelerometer band which were comparable for total sleep estimates. In any case, I already have the Zeo and I’ve come to like the detailed information.↩︎
I had previously tried huperzine-A and subjectively noticed no effect from it, but I had no way of really noticing any effect on sleep, and Timothy Ferriss in his The Four-hour Body claims:
↩︎Taking 200 milligrams of huperzine-A 30 minutes before bed can increase total REM by 20-30%. Huperzine-A, an extract of Huperzia serrata, slows the breakdown of the neurotransmitter acetylcholine. It is a popular nootropic (smart drug), and I have used it in the past to accelerate learning and increase the incidence of lucid dreaming. I now only use huperzine-A for the first few weeks of language acquisition, and no more than three days per week to avoid side effects. Ironically, one documented side effect of overuse is insomnia. The brain is a sensitive instrument, and while generally well tolerated, this drug is contraindicated with some classes of medications. Speak with your doctor before using.
My own suspicion is that given the existence of neuron-level sleep in mice, poor self-monitoring in humans, and anecdotal reports about polyphasic sleep, is that polyphasic sleep is a real & workable phenomenon but that it comes at the price of a large chunk of mental performance.↩︎
Kruschke 2012 argues that there is no need for people to use the old framework of p-values and null hypotheses etc., with their many well-known philosophical difficulties and misleading interpretations—interpretations I, alas, perpetuate in my analyses with my use of statistical-significance:
Nevertheless, some people have the impression that conclusions from NHST and Bayesian methods tend to agree in simple situations such as comparison of two groups: “Thus, if your primary question of interest can be simply expressed in a form amenable to a t-test, say, there really is no need to try and apply the full Bayesian machinery to so simple a problem.” (Brooks, 2003, p. 2694) This article shows, to the contrary, that Bayesian parameter estimation provides much richer information than the NHST t-test, and that its conclusions can differ from those of the NHST t-test. Decisions based on Bayesian parameter estimation are better founded than NHST, whether the decisions of the two methods agree or not. The conclusion is bold but simple: Bayesian parameter estimation supersedes the NHST t-test.
Unfortunately, while I have no love for NHST, I did find it much easier to use the NHST concepts & code when learning how to do these analyses. In the future, hopefully I can switch to Bayesian techniques.↩︎
The usual way to correct for the issue of multiple comparisons inflating results (a big problem in epidemiology and why their results are so often false) is to use a Bonferroni correction—if I look at the p-values for 7 Zeo metrics, I wouldn’t consider any to be statistically-significant at ‘p = 0.05’ unless they were actually statistically-significant at 0.05 / 7 = 0.00714 = 0.007, which is even more stringent than the rarer ‘p = 0.01’ criterion. With the even stronger criterion ‘p = 0.007’, it’s a safe bet than none of my tests give statistically-significant results. Which may be the right thing to conclude, since all my data is just n = 1 and unreliable in many ways, but still, the Bonferroni correction is not being very helpful here.
The caveat is that the Bonferroni correction is intended for use on ‘independent’ data, while the Zeo metrics are all very dependent, some by definition (eg. ZQ is defined partly as what the REM sleep length was, AFAIK). So while the Bonferroni correction will still do the job of only letting through really statistically-significant data, it’ll do so by throwing out way more potentially good results than one has to. (It’ll avoid some false positives by making many false negatives.) So what should we do?
Andy McKenzie suggested limiting our false discovery rate by using the method of Benjamin & Hochberg 1995:
↩︎…let’s say that you test 6 hypotheses, corresponding to different features of your Zeo data. You could use a t-test for each, as above. Then aggregate and sort all the p-values in ascending order. Let’s say that they are 0.001, 0.013, 0.021, 0.030, 0.067, and 0.134.
Assume, arbitrarily, that you want the overall false discovery rate to be 0.05, which is in this context called the q-value. You would then sequentially test, from the last value to the first, whether the current p-value is less than (the current index ⋅ false discovery rate) ⧸ overall number of hypotheses. You stop when you get to the first true inequality and call the p-values of the rest of the hypotheses [statistically-]significant.
So in this example, you would stop when you correctly call 0.030 < (4 ⋅ 0.05)⧸6, and only the hypotheses corresponding to the first four [smallest] p-values would be called [statistically-]significant.
If we correct for multiple comparisons (see previous footnote) at q-value=0.05, none of them survive:
p.adjust(c(0.11,0.77,0.89,0.16,0.63,0.74,0.73,0.63,0.20), method="BH") < 0.05
# [1] FALSE FALSE FALSE FALSE FALSE FALSE FALSE FALSE FALSE
Oh well.↩︎
“Blocking” is a style of variation on a simple randomized design where instead of considering each day separate and randomizing a single day, we instead randomize pairs of days, or more; so instead of flipping our coin to decide whether ‘this week’ is placebo, we flip our coin to decide whether ‘this week will be placebo & next active’ or ‘this week active & next placebo’. This has 2 big advantages which justify the complexity:
Often, I’m worried about simple randomization leading to an imbalance in sample vs experimental; if I’m only getting 20 total datapoints on something, then randomization could easily lead to something like 14 control and 6 experimental datapoints—throwing out a lot of statistical power compared to 10 control and 10 experimental! Why am I losing power? Because data is subject to diminishing returns: each new point reduces the standard error of your estimates less than the previous one did (since the total error shrinks as, roughly, inverse of the square root of the total sample size; the difference between √1 and √2 is bigger and shrinks error more than √2 vs √3, etc.) . So the extra 4 control datapoints reduce the error less than the lost 4 experimental datapoints would have, and this leaves me with a final answer less precise than if it had been exactly 10:10. (If diminishing returns isn’t intuitive, imagine taking it to an extreme: is 10:10 just as good as 5:15? As good as 2:18? How about 0:20?) But if I pair days like this, then I know I will get exactly 10:10.
Blocking is the natural way to handle multiple-day effects or trends: if I think lithium operates slowly, I will pair entire weeks or months, rather than days and hoping enough experimental and control days form runs which will reveal any trend rather than wash it out in averaging.
The net present value formula is the annual savings divided by the natural log of the discount rate, out to eternity. Exponential discounting means that a bond that expires in 50 years is worth a surprisingly similar amount to one that continues paying out forever. For example, a 50 year bond paying $15.01$102013 a year at a discount rate of 5% is worth
sum (map (\t -> 10 / (1 + 0.05)^t) [1..50]) → 182.5but if that same bond never expires, it’s worth10 / log 1.05 = 204.9or just $33.62$22.42013 more! My own expected longevity is ~50 more years, but I prefer to use the simple natural log formula rather than the more accurate summation. Either way is interesting; Vaniver:
↩︎…possibly a way to drive it home is to talk about dividing by
log 1.05, which is essentially multiplying by 20.5. If you can make a one-time investment that pays off annually until you die, that’s worth 20.5 times the annual return, and multiplying the value of something by 20 can often move it from not worth thinking about to worth thinking about.Vaniver notes that one reason I might be less confident than you would expect is that many substances or supplements lose effect over time as one’s body regains homeostasis and compensates for the substance, building tolerance. Which is quite true, and a major reason I tested melatonin—I was sure it worked for me in the past, but did it still work?↩︎
For simplicity, in all my VoI calculations I assume that I’ll stop buying the supplement (or doing the activity) if I hit a negative result. The proper way a real analyst would do this value of information question would be to say that the negative result gives us additional information which changes the expected-value of melatonin use.
In my melatonin article article, I calculated that since melatonin saved me close to an hour while each dose cost literally a penny or two, the value was astronomical—$3,528.48$2,350.62013 a year! By Bayes’ formula, if I started with 80% confidence and had a 95% accurate test, a negative result drops my 80% all the way down to 17%. We get this by using a derivation of Bayes’s theorem:
But ironically if I now believed that melatonin only had a 17% chance of doing something helpful rather than nothing at all (as compared to my original 80% belief), well, 17% of $3,527.58$2,3502013 ($175.63$1172013) is still way more money than the melatonin cost ($15.01$102013), so I’d use it anyway!
Would it make sense to iterate again and test melatonin a second time? Well, what does the calculation say? We have a new prior of 17; what happens if we get a negative result again? and then the expected value is 0.0107… × 2350 = 25.7, which is not much more than the cost of $15.01$102013, and given the difficult-to-quantify possibility of negative long-term health effects, is not enough of a profit to really entice me.↩︎
Technology Review editor Emily Singer noticed the same problem when using her Zeo.↩︎
The R interpreter session, loading a CSV as before:
↩︎zeo <- read.csv("https://gwern.net/doc/zeo/2011-zeo-oneleg.csv") colnames(zeo)[24] <- "OneLeg" l <- lm(cbind(ZQ, Total.Z, Time.to.Z, Time.in.Wake, Time.in.REM, Time.in.Light, Time.in.Deep, Awakenings, Morning.Feel) ~ OneLeg, data=zeo) summary(manova(l)) # Df Pillai approx F num Df den Df Pr(>F) # OneLeg 1 0.177 1.37 9 57 0.23 # Residuals 65 summary(l) # Response ZQ : # # Coefficients: # Estimate Std. Error t value Pr(>|t|) # (Intercept) 96.231 1.712 56.22 <2e-16 # OneLeg -1.244 0.883 -1.41 0.16 # # Response Total.Z : # # Coefficients: # Estimate Std. Error t value Pr(>|t|) # (Intercept) 514.67 8.84 58.2 <2e-16 # OneLeg -4.09 4.56 -0.9 0.37 # # Response Time.to.Z : # # Coefficients: # Estimate Std. Error t value Pr(>|t|) # (Intercept) 14.949 1.373 10.89 2.7e-16 # OneLeg 0.469 0.708 0.66 0.51 # # Response Time.in.Wake : # # Coefficients: # Estimate Std. Error t value Pr(>|t|) # (Intercept) 12.821 2.786 4.60 2e-05 # OneLeg -0.369 1.436 -0.26 0.8 # # Response Time.in.REM : # # Coefficients: # Estimate Std. Error t value Pr(>|t|) # (Intercept) 168.72 4.25 39.70 <2e-16 # OneLeg -5.33 2.19 -2.43 0.018 # # Response Time.in.Light : # # Coefficients: # Estimate Std. Error t value Pr(>|t|) # (Intercept) 277.15 6.06 45.75 <2e-16 # OneLeg 2.76 3.12 0.88 0.38 # # Response Time.in.Deep : # # Coefficients: # Estimate Std. Error t value Pr(>|t|) # (Intercept) 69.282 1.802 38.44 <2e-16 # OneLeg -1.558 0.929 -1.68 0.098 # # Response Awakenings : # # Coefficients: # Estimate Std. Error t value Pr(>|t|) # (Intercept) 4.1538 0.3690 11.26 <2e-16 # OneLeg -0.0513 0.1902 -0.27 0.79 # # Response Morning.Feel : # # Coefficients: # Estimate Std. Error t value Pr(>|t|) # (Intercept) 2.8718 0.1014 28.3 <2e-16 # OneLeg -0.0525 0.0523 -1.0 0.32If we correct for multiple comparisons (see previous footnote on the Bonferroni correction) at q-value=0.05, none of them survive:
p.adjust(c(0.16,0.37,0.51,0.80,0.02,0.38,0.10,0.79,0.32), method="BH") < 0.05
# [1] FALSE FALSE FALSE FALSE FALSE FALSE FALSE FALSE FALSE
Oh well! Statistics is a harsh mistress indeed.↩︎
I don’t use a timer, but instead count 400 full breaths. Depending on how fast and shallowly I breathe, this runs from 20-35 minutes (eg. 2012-05-16’s meditation ran 33 minutes long). To be conservative, I will assume the meditation is only 20 minutes. In mid-October, I bought and began using instead a timer which could be set to 15 minutes.↩︎
The exact processing steps, for those curious:
↩︎zeo <- read.csv("https://gwern.net/doc/zeo/gwern-zeodata.csv") zeo$Sleep.Date <- as.Date(zeo$Sleep.Date, format="%m/%d/%Y") mp <- read.csv("mp.csv", colClasses=c("Date","factor")) zeo$MP <- ordered(mp[mp$Date %in% zeo$Sleep.Date,]$MP) zeo$Disturbance <- scale(zeo$Time.to.Z) + scale(zeo$Awakenings) + scale(zeo$Time.in.Wake) zeo <- zeo[!is.na(zeo$Disturbance) & !is.na(zeo$Morning.Feel),]Load & correlate:
↩︎zeo <- read.csv("https://gwern.net/doc/zeo/2013-gwern-sleepdisturbances-productivity.csv") cor.test(zeo$Disturbance, as.integer(zeo$MP)) # # Pearson`s product-moment correlation # # data: zeo$Disturbance and as.integer(zeo$MP) # t = 1.344, df = 414, p-value = 0.1798 # alternative hypothesis: true correlation is not equal to 0 # 95% confidence interval: # -0.03045 0.16102 # sample estimates: # cor # 0.06589We regress a continuous predictor onto a categorical outcome:
↩︎# turn into an ordinal variable zeo$MP <- ordered(zeo$MP) library(MASS) lmodel <- polr(MP ~ Disturbance, data = zeo); summary(lmodel) # ... # Coefficients: # Value Std. Error t value # Disturbance 0.0553 0.0429 1.29 # # Intercepts: # Value Std. Error t value # 1|2 -4.413 0.450 -9.808 # 2|3 -0.990 0.110 -8.965 # 3|4 1.101 0.113 9.711 # # Residual Deviance: 915.66 # AIC: 923.66 exp(lmodel$coefficients) # Disturbance # 1.057Try out more variables:
↩︎almodel <- polr(MP ~ Disturbance + ZQ + Total.Z + Time.to.Z + Time.in.Wake + Time.in.REM + Time.in.Light + Time.in.Deep + Awakenings + Morning.Feel, data = zeo); almodel # # Coefficients: # Disturbance ZQ Total.Z Time.to.Z Time.in.Wake Time.in.REM Time.in.Light # -0.431623 -0.276236 0.307941 0.045819 0.003266 -0.246901 -0.272593 # Time.in.Deep Morning.Feel # -0.227003 0.205541 # # Intercepts: # 1|2 2|3 3|4 # -2.9105 0.5465 2.6902 # # Residual Deviance: 903.01 # AIC: 927.01Reduced by cutting out extraneous variables using stepwise regression:
↩︎salmodel <- step(almodel); summary(salmodel) # ... # Coefficients: # Value Std. Error t value # Time.to.Z 0.0163 0.00713 2.29 # Time.in.Deep -0.0152 0.00823 -1.85 # Morning.Feel 0.1906 0.12683 1.50 # # Intercepts: # Value Std. Error t value # 1|2 -4.457 0.785 -5.675 # 2|3 -1.011 0.649 -1.557 # 3|4 1.113 0.649 1.713 # # Residual Deviance: 907.60 # AIC: 919.60