Predicting Google closures
Analyzing predictors of Google abandoning products; predicting future shutdowns
Prompted by the shutdown of Google Reader, I ponder the evanescence of online services and wonder what is the risk of them disappearing.
I collect data on 350 Google products launched before March 201313ya, looking for variables predictive of mortality (web hits, service vs software, commercial vs free, FLOSS, social networking, and internal vs acquired). Shutdowns are unevenly distributed over the calendar year or Google’s history. I use logistic regression & survival analysis (which can deal with right-censorship) to model the risk of shutdown over time and examine correlates.
The logistic regression indicates socialness, acquisitions, and lack of web hits predict being shut down, but the results may not be right. The survival analysis finds a median lifespan of 2824 days with a Type III survival curve (high early-life mortality); a Cox regression finds similar results as the logistic: socialness, free, acquisition, and long life predict longevity. Using the best model, I make predictions about probability of shutdown of the most risky and least risky services in the next 5 years (up to March 2018).
(All data & R source code is provided.)
Google has occasionally shut down services I use, and not always with serious warning (many tech companies are like that - here one day and gone the next - though Google is one of the least-worst); this is frustrating and tedious.
Naturally, we are preached at by apologists that Google owes us nothing and if it’s a problem then it’s all our fault and we should have prophesied the future better (and too bad about the ordinary people who may be screwed over or the unique history1 or data casually destroyed).
But how can we have any sort of rational expectation if we lack any data or ideas about how long Google will run anything or why or how it chooses to do what it does? So in the following essay, I try to get an idea of the risk, and hopefully the results are interesting, useful, or both.
A Glance Back
This is something that literature has always been very keen on, that technology never gets around to acknowledging. The cold wind moaning through the empty stone box. When are you gonna own up to it? Where are the Dell PCs? This is Austin, Texas. Michael Dell is the biggest tech mogul in central Texas. Why is he not here? Why is he not at least not selling his wares? Where are the dedicated gaming consoles you used to love? Do you remember how important those were? I could spend all day here just reciting the names of the causalities in your line of work. It’s always the electronic frontier. Nobody ever goes back to look at the electronic forests that were cut down with chainsaws and tossed into the rivers. And then there’s this empty pretense that these innovations make the world ‘better’…Like: ‘If we’re not making the world better, then why are we doing this at all?’ Now, I don’t want to claim that this attitude is hypocritical. Because when you say a thing like that at South By: ‘Oh, we’re here to make the world better’—you haven’t even reached the level of hypocrisy. You’re stuck at the level of childish naivete.
The shutdown of the popular service Google Reader, announced on 2013-03-13, has brought home to many people that some products they rely on exist only at Google’s sufferance: it provides the products for reasons that are difficult for outsiders to divine, may have little commitment to a product234, may not include their users’ best interests, may choose to withdraw the product at any time for any reason5 (especially since most of the products are services6 & not FLOSS in any way, and may be too tightly coupled with the Google infrastructure7 to be spun off or sold, so when the CEO turns against it & no Googlers are willing to waste their careers championing it…), and users have no voice8 - only exit as an option.
Andy Baio (“Never Trust a Corporation to do a Library’s Job”) summarizes Google’s track record:
“Google’s mission is to organize the world’s information and make it universally accessible and useful.”
For years, Google’s mission included the preservation of the past. In 200125ya, Google made their first acquisition, the Deja archives. The largest collection of Usenet archives, Google relaunched it as Google Groups, supplemented with archived messages going back to 198145ya. In 200422ya, Google Books signaled the company’s intention to scan every known book, partnering with libraries and developing its own book scanner capable of digitizing 1,000 pages per hour. In 200620ya, Google News Archive launched, with historical news articles dating back 200 years. In 200818ya, they expanded it to include their own digitization efforts, scanning newspapers that were never online. In the last five years, starting around 201016ya, the shifting priorities of Google’s management left these archival projects in limbo, or abandoned entirely. After a series of redesigns, Google Groups is effectively dead for research purposes. The archives, while still online, have no means of searching by date. Google News Archives are dead, killed off in 201115ya, now directing searchers to just use Google. Google Books is still online, but curtailed their scanning efforts in recent years, likely discouraged by a decade of legal wrangling still in appeal. The official blog stopped updating in 201214ya and the Twitter account’s been dormant since February 201313ya. Even Google Search, their flagship product, stopped focusing on the history of the web. In 201115ya, Google removed the Timeline view letting users filter search results by date, while a series of major changes to their search ranking algorithm increasingly favored freshness over older pages from established sources. (To the detriment of some.)…As it turns out, organizing the world’s information isn’t always profitable. Projects that preserve the past for the public good aren’t really a big profit center. Old Google knew that, but didn’t seem to care.
In the case of Reader, while Reader destroyed the original RSS reader market, there still exist some usable alternatives; the consequence is a shrinkage in the RSS audience as inevitably many users choose not to invest in a new reader or give up or interpret it as a deathblow to RSS, and an irreversible loss of Reader’s uniquely comprehensive RSS archives back to 200521ya. Although to be fair, I should mention 2 major points in favor of Google:
a reason I did and still do use Google services is that, with a few lapses like Website Optimizer aside, they are almost unique in enabling users to back up their data via the work of the Google Data Liberation Front and have been far more proactive than many companies in encouraging users to back up data from dead services - for example, in automatically copying Buzz users’ data to their Google Drive.
Google’s practices of undercutting all market incumbents with free services also has very large benefits9, so we shouldn’t focus just on the seen.
Nevertheless, every shutdown still hurts its users to some degree, even if we—currently10—can rule out the most devastating possible shutdowns, like Gmail. It would be interesting to see if shutdowns are to some degree predictable, whether there are any patterns, whether common claims about relevant factors can be confirmed, and what the results might suggest for the future.
Data
Sources
Dead Products
The summer grasses—
the sole remnants of many
brave warriors’ dreams.Bashō
I begin with a list of services/APIs/programs that Google has shutdown or abandoned taken from the Guardian article “Google Keep? It’ll probably be with us until March 2017 - on average: The closure of Google Reader has got early adopters and developers worried that Google services or APIs they adopt will just get shut off. An analysis of 39 shuttered offerings says how long they get” by Charles Arthur. Arthur’s list seemed relatively complete, but I’ve added in >300 items he missed based on the Slate graveyard, Weber’s “Google Fails 36% Of The Time”11, the Wikipedia category/list for Google acquisitions, the Wikipedia category/list, and finally the official Google History. (The additional shutdowns include many shutdowns predating 201016ya, suggesting that Arthur’s list was biased towards recent shutdowns.)
In a few cases, the start dates are well-informed guesses (eg. Google Translate) and dates of abandonment/shut-down are even harder to get due to the lack of attention paid to most (Joga Bonito) and so I infer the date from archived pages on the Internet Archive, news reports, blogs such as Google Operating System, the dates of press releases, the shutdown of closely related services (eReader Play based on Reader), source code repositories (AngularJS) etc.; some are listed as discontinued (Google Catalogs) but are still supported or were merged into other software (Spreadsheets, Docs, Writely, News Archive) or sold/given to third parties (Flu Shot Finder, App Inventor, Body) or active effort has ceased but the content remains and so I do not list those as dead; for cases of acquired software/services that were shutdown, I date the start from Google’s purchase.
Live Products
…He often lying broad awake, and yet
Remaining from the body, and apart
In intellect and power and will, hath heard
Time flowing in the middle of the night,
And all things creeping to a day of doom.Lord Alfred Tennyson, “The Mystic”, Poems, Chiefly Lyrical
A major criticism of Arthur’s post was that it was fundamentally using the wrong data: if you have a dataset of all Google products which have been shutdown, you can make statements like “the average dead Google product lived 1459 days”, but you can’t infer very much about a live product’s life expectancy - because you don’t know if it will join the dead products. If, for example, only 1% of products ever died, then 1459 days would lead to a massive underestimates of the average lifespan of all currently living products. With his data, you can only make inferences conditional on a product eventually dying, you cannot make an unconditional inference. Unfortunately, the unconditional question “will it die?” is the real question any Google user wants answered!
So drawing on the same sources, I have compiled a second list of living products; the ratio of living to dead gives a base rate for how likely a randomly selected Google product is to be canceled within the 1997–16201313ya window, and with the date of the founding of each living product, we can also do a simple right-censored survival analysis which will let us make better still predictions by extracting concrete results like mean time to shutdown. Some items are dead in the most meaningful sense since they have been closed to new users (Sync), lost major functionality (FeedBurner, Meebo), degraded severely due to neglect (eg. Google Alerts), or just been completely neglected for a decade or more (Google Group’s Usenet archive) - but haven’t actually died or closed yet, so I list them as alive.
Variables
To my good friend
Would I show, I thought,
The plum blossoms,
Now lost to sight
Amid the falling snow.
Simply collecting the data is useful since it allows us to make some estimates like overall death-rates or median lifespan. But maybe we can do better than just base rates and find characteristics which let us crack open the Google black box a tiny bit. So finally, for all products, I have collected several covariates which I thought might help predict longevity:
Hits: the number of Google hits for a serviceWhile number of Google hits is a very crude measure, at best, for underlying variables like “popularity” or “number of users” or “profitability”, and clearly biased towards recently released products (there aren’t going to be as many hits for, say, “Google Answers” as there would have been if we had searched for it in 200224ya), it may add some insight.
There do not seem to be any other free quality sources indicating either historical or contemporary traffic to a product URL/homepage which could be used in the analysis - services like Alexa or Google Ad Planner either are commercial, for domains only, or simply do not cover many of the URLs. (After I finished data collection, it was pointed out to me that while Google’s Ad Planner may not be useful, Google’s AdWords does yield a count of global searches for a particular query that month, which would have worked albeit it would only indicate current levels of interest and nothing about historical levels.)
Type: a categorization into “service”/“program”/“thing”/“other”A service is anything primarily accessed through a web browser or API or the Internet; so Gmail or a browser loading fonts from a Google server, but not a Gmail notification program one runs on one’s computer or a FLOSS font available for download & distribution.
A program is anything which is an application, plugin, library, framework, or all of these combined; some are very small (Authenticator) and some are very large (Android). This does include programs which require Internet connections or Google APIs as well as programs for which the source code has not been released, so things in the program category are not immune to shutdown and may be useful only as long as Google supports them.
A thing is anything which is primarily a physical object. A cellphone running Android or a Chromebook would be an example.
In retrospect, I probably should have excluded this category entirely: there’s no reason to expect cellphones to follow the same lifecycle as a service or program, it leads to even worse classification problems (when does an Android cellphone ‘die’? should one even be looking at individual cellphones or laptops rather than entire product lines?), there tend to be many iterations of a product and they’re all hard to research, etc.
Other is the catch-all category for things which don’t quite seem to fit. Where does a Google think-tank, charity, conference, or venture capital fund fit in? They certainly aren’t software, but they don’t seem to be quite services either.
Profit: whether Google directly makes money off a productThis is a tricky one. Google excuses many of its products by saying that anything which increases Internet usage benefits Google and so by this logic, every single one of its services could potentially increase profit; but this is a little stretched, the truth very hard to judge by an outsider, and one would expect that products without direct monetization are more likely to be killed.
Generally, I classify as for profit any Google product directly relating to producing/displaying advertising, paid subscriptions, fees, or purchases (AdWords, Gmail, Blogger, Search, shopping engines, surveys); but many do not seem to have any form of monetization related to them (Alerts, Office, Drive, Gears, Reader12). Some services like Voice charge (for international calls) but the amounts are minor enough that one might wonder if classifying them as for profit is really right. While it might make sense to define every feature added to, say, Google Search (eg. Personalized Search, or Search History) as being ‘for profit’ since Search lucratively displays ads, I have chosen to classify these secondary features as being not for profit.
FLOSS: whether the source code was released or Google otherwise made it possible for third parties to continue the service or maintain the application.In the long run, the utility of all non-Free software approaches zero. All non-Free software is a dead end.13
Android, AngularJS, and Chrome are all examples of software products where Google losing interest would not be fatal; services spun off to third parties would also count. Many of the codebases rely on a proprietary Google API or service (especially the mobile applications), which means that this variable is not as meaningful and laudable as one might expect, so in the minority of cases where this variable is relevant, I code
Dead&Endedas related to whether & when Google abandoned it, regardless of whether it was then picked up by third parties or not. (Example: App Inventor for Android is listed as dying in December 201115ya, though it was then half a year later handed over to MIT, who has supported it since.) It’s important to not naively believe that simply because source code is available, Google support doesn’t matter.Acquisition: whether it was related to a purchase of a company or licensing, or internally developed.This is useful for investigating the so-called “Google black hole”: Google has bought many startups (DoubleClick, Dodgeball, Android, Picasa), or technologies/data licensed (SYSTRAN for Translate, Twitter data for Real-Time Search), but it’s claimed many stagnate & wither (Jaiku, JotSpot, Dodgeball, Zagat). So we’ll include this. If a closely related product is developed and released after purchase, like a mobile application, I do not class it as an acquisition; just products that were in existence when the company was purchased. I do not include products that Google dropped immediately on purchase (Apture, fflick, Sparrow, Reqwireless, PeakStream, Wavii) or where products based on them have not been released (BumpTop).
Hits
Ideally we would have Google hits from the day before a product was officially killed, but the past is, alas, no longer accessible to us, and we only have hits from searches I conducted 2013-04-01–2013-04-0513ya. There are three main
the Web keeps growing, so 1 million hits in 200026ya are not equivalent to 1 million hits in 2013
services which are not killed live longer and can rack up more hits
and the longer ago a product’s hits came into existence, the more likely the relevant hits may be to have disappeared themselves.
We can partially compensate by looking at hits averaged by lifespan; 100k hits means much less for something that lived for a decade than 100k hits means for something that lived just 6 months. What about the growth objection? We can estimate the size of Google’s index at any period and interpret the current hits as a fraction of the index when the service died (example: suppose Answers has 1 million hits, died in 200620ya, and in 200620ya the index held 1 billion URLs, then we’d turn our 1m hit figure into 1/1,000 or 0.001); this gives us our “deflated hits”. We’ll deflate the hits by first estimating the size of the index by fitting an exponential to the rare public reports and third-party estimates of the size of the Google index. The data points with the best linear fit:
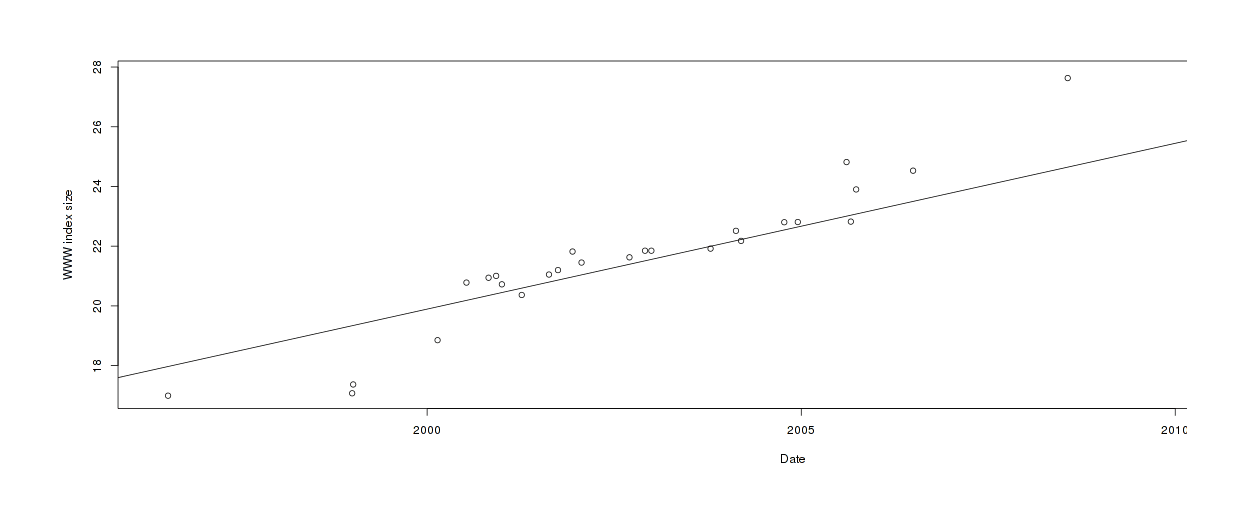
Estimating Google WWW index size over time
It fits reasonably well. (A sigmoid might fit better, but maybe not, given the large disagreements towards the end.) With this we can then average over days as well, giving us 4 indices to use. We’ll look closer at the hit variables later.
Processing
If a product has not ended, the end-date is defined as 2013-04-01 (which is when I stopped compiling products); then the total lifetime is simply the end-date minus the start-date. The final CSV is available at 2013-google.csv. (I welcome corrections from Googlers or Xooglers about any variables like launch or shutdown dates or products directly raising revenue.)
Analysis
I spur my horse past ruins
Ruins move a traveler’s heart
the old parapets high and low
the ancient graves great and small
the shuddering shadow of a tumbleweed
the steady sound of giant trees.
But what I lament are the common bones
unnamed in the records of Immortals.
Descriptive
Loading up our hard-won data and looking at an R summary (for full source code reproducing all graphs and analyses below, see the appendix; I welcome statistical corrections or elaborations if accompanied by equally reproducible R source code), we can see we have a lot of data to look at:
    Dead            Started               Ended                 Hits               Type
#  Mode :logical   Min.   :1997-09-15   Min.   :2005-03-16   Min.   :2.04e+03   other  : 14
#  FALSE:227       1st Qu.:2006-06-09   1st Qu.:2012-04-27   1st Qu.:1.55e+05   program: 92
#  TRUE :123       Median :2008-10-18   Median :2013-04-01   Median :6.50e+05   service:234
#                  Mean   :2008-05-27   Mean   :2012-07-16   Mean   :5.23e+07   thing  : 10
#                  3rd Qu.:2010-05-28   3rd Qu.:2013-04-01   3rd Qu.:4.16e+06
#                  Max.   :2013-03-20   Max.   :2013-11-01   Max.   :3.86e+09
#    Profit          FLOSS         Acquisition       Social             Days         AvgHits
#  Mode :logical   Mode :logical   Mode :logical   Mode :logical   Min.   :   1   Min.   :      1
#  FALSE:227       FALSE:300       FALSE:287       FALSE:305       1st Qu.: 746   1st Qu.:    104
#  TRUE :123       TRUE :50        TRUE :63        TRUE :45        Median :1340   Median :    466
#                                                                  Mean   :1511   Mean   :  29870
#                                                                  3rd Qu.:2112   3rd Qu.:   2980
#                                                                  Max.   :5677   Max.   :3611940
#   DeflatedHits    AvgDeflatedHits  EarlyGoogle      RelativeRisk    LinearPredictor
#  Min.   :0.0000   Min.   :-36.57   Mode :logical   Min.   : 0.021   Min.   :-3.848
#  1st Qu.:0.0000   1st Qu.: -0.84   FALSE:317       1st Qu.: 0.597   1st Qu.:-0.517
#  Median :0.0000   Median : -0.54   TRUE :33        Median : 1.262   Median : 0.233
#  Mean   :0.0073   Mean   : -0.95                   Mean   : 1.578   Mean   : 0.000
#  3rd Qu.:0.0001   3rd Qu.: -0.37                   3rd Qu.: 2.100   3rd Qu.: 0.742
#  Max.   :0.7669   Max.   :  0.00                   Max.   :12.556   Max.   : 2.530
#  ExpectedEvents   FiveYearSurvival
#  Min.   :0.0008   Min.   :0.0002
#  1st Qu.:0.1280   1st Qu.:0.1699
#  Median :0.2408   Median :0.3417
#  Mean   :0.3518   Mean   :0.3952
#  3rd Qu.:0.4580   3rd Qu.:0.5839
#  Max.   :2.0456   Max.   :1.3443
Shutdowns over Time
Google Reader: “Who is it in the blogs that calls on me? / I hear a tongue shriller than all the YouTubes / Cry ‘Reader!’ Speak, Reader is turn’d to hear.”
Dataset: “Beware the ideas of March.”
Google Reader Act 1, scene 2, 15-19; with apologies.
An interesting aspect of the shutdowns is they are unevenly distributed by month as we can see with a chi-squared test (p = 0.014) and graphically, with a major spike in September and then March/April15:
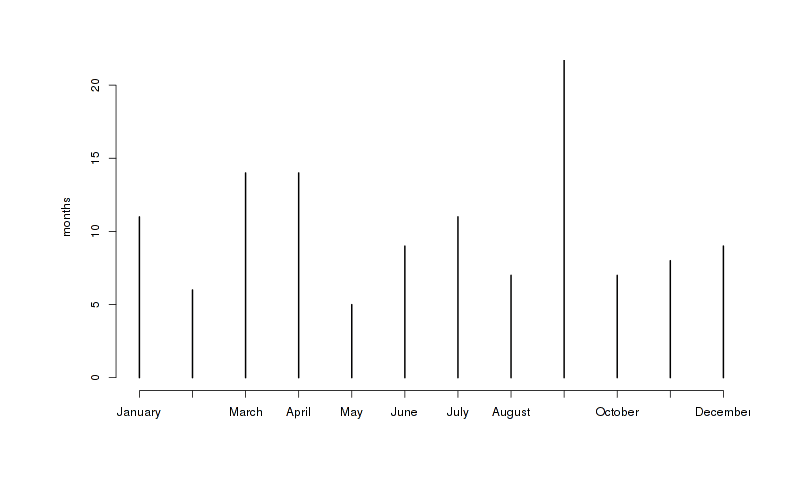
Shutdowns binned by month of year, revealing peaks in September, March, and April
As befits a company which has grown enormously since 199729ya, we can see other imbalances over time: eg. Google launched very few products from 1997–7200422ya, and many more from 200521ya and on:
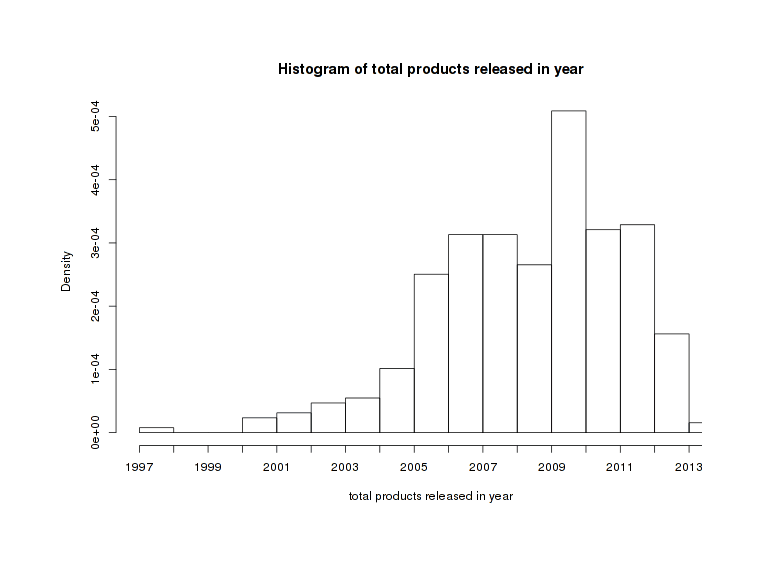
Starts binned by year
We can plot lifetime against shut-down to get a clearer picture:
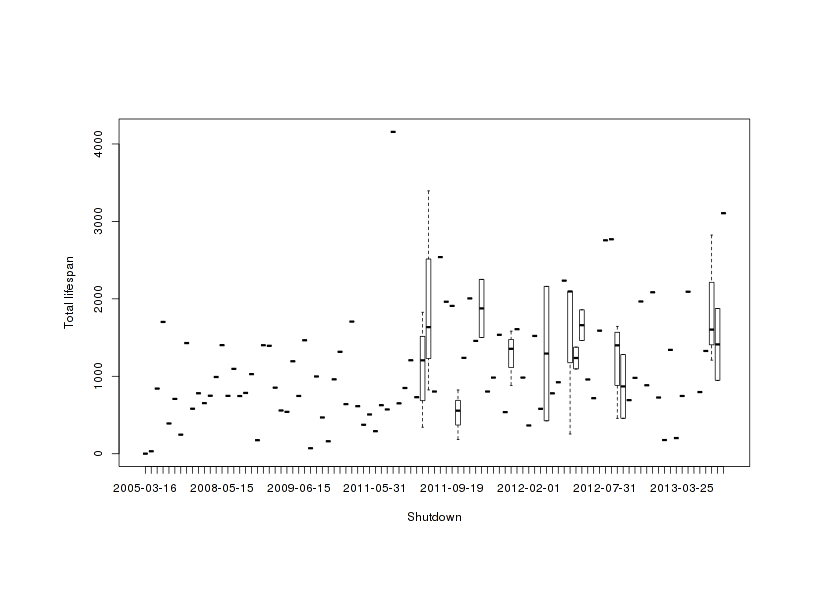
All products scatter-plotted date of opening vs lifespan
That clumpiness around 200917ya is suspicious. To emphasize this bulge of shutdowns in late 2011–201214ya, we can plot the histogram of dead products by year and also a kernel density:
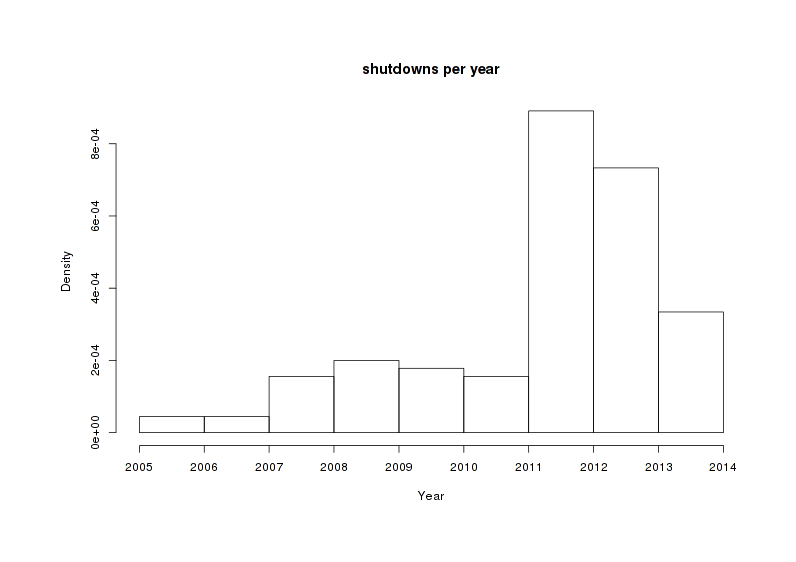
Shutdown density binned by year
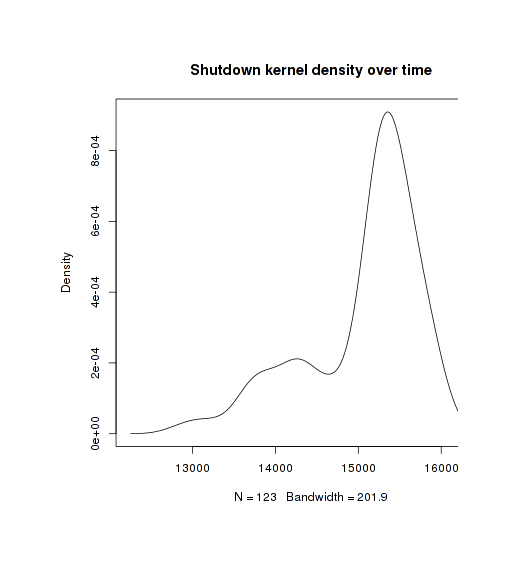
Equivalent kernel density (default bandwidth)
The kernel density brings out an aspect of shutdowns we might have missed before: there seems to be an absence of recent shut downs. There are 4 shut downs scheduled for 201313ya but the last one is scheduled for November, suggesting that we have seen the last of the 201313ya casualties and that any future shut downs may be for 201412ya.
What explains such graphs over time? One candidate is the 2011-04-04 accession of Larry Page to CEO, replacing Eric Schmidt who had been hired to provide “adult supervision” for pre-IPO Google. He respected Steve Jobs greatly (he and Brin suggested, before meeting Schmidt, that their CEO be Jobs). Isaacon’s Steve Jobs records that before his death, Jobs had strongly advised Page to “focus”, and asked “What are the five products you want to focus on?”, saying “Get rid of the rest, because they’re dragging you down.” And on 2011-07-14 Page posted:
…Greater focus has also been another big feature for me this quarter—more wood behind fewer arrows. Last month, for example, we announced that we will be closing Google Health and Google PowerMeter. We’ve also done substantial internal work simplifying and streamlining our product lines. While much of that work has not yet become visible externally, I am very happy with our progress here. Focus and prioritization are crucial given our amazing opportunities.
While some have tried to disagree, it’s hard not to conclude that indeed, a wall of shutdowns followed in late 201115ya and 201214ya. But this sound very much like a one-time purge: if one has a new focus on focus, then one may not be starting up as many services as before and the services which one does start up should be more likely to survive.
Modeling
Logistic Regression
A first step in predicting when a product will be shutdown is predicting whether it will be shutdown. Since we’re predicting a binary outcome (a product living or dying), we can use the usual: an ordinary logistic regression. Our first look uses the main variables plus the total hits:
# Coefficients:
#                 Estimate Std. Error z value Pr(>|z|)
# (Intercept)       2.3968     1.0680    2.24    0.025
# Typeprogram       0.9248     0.8181    1.13    0.258
# Typeservice       1.2261     0.7894    1.55    0.120
# Typething         0.8805     1.1617    0.76    0.448
# ProfitTRUE       -0.3857     0.2952   -1.31    0.191
# FLOSSTRUE        -0.1777     0.3791   -0.47    0.639
# AcquisitionTRUE   0.4955     0.3434    1.44    0.149
# SocialTRUE        0.7866     0.3888    2.02    0.043
# log(Hits)        -0.3089     0.0567   -5.45  5.1e-08
In log odds, >0 increases the chance of an event (shutdown) and <0 decreases it. So looking at the coefficients, we can venture some interpretations:
Google has a past history of screwing up social and then killing them
This is interesting for confirming the general belief that Google has handled badly its social properties in the past, but I’m not sure how useful this is for predicting the future: since Larry Page became obsessed with social in 200917ya, a we might expect anything to do with “social” would be either merged into Google+ or otherwise be kept on life support longer than it would before
Google is deprecating software products in favor of web services
A lot of Google’s efforts with Firefox and then Chromium was for improving web browsers as a platform for delivering applications. As efforts like HTML5 mature, there is less incentive for Google to release and support standalone software.
But apparently not its FLOSS software
This seems due to a number of its software releases being picked up by third-parties (Wave, Etherpad, Refine), designed to be integrated into existing communities (Summer of Code projects), or apparently serving a strategic role (Android, Chromium, Dart, Go, Closure Tools, VP Codecs) in which we could summarize as ‘building up a browser replacement for operating systems’. (Why? “Commoditize your complements.”)
things which charge or show advertising are more likely to survive
We expect this, but it’s good to have confirmation (if nothing else, it partially validates the data).
Popularity as measured by Google hits seems to matter
…Or does it? This variable seems particularly treacherous and susceptible to reverse-causation issues (does lack of hits diagnose failure, or does failing cause lack of hits when I later searched?)
Use of Hits Data
Is our popularity metric - or any of the 4 - trustworthy? All this data has been collected after the fact, sometimes many years; what if the data have been contaminated by the fact that something shutdown? For example, by a burst of publicity about an obscure service shutting down? (Ironically, this page is contributing to the inflation of hits for any dead service mentioned.) Are we just seeing information “leakage”? Leakage can be subtle, as I learned for myself doing this analysis.
Investigating further, hits by themselves do matter:
#             Estimate Std. Error z value Pr(>|z|)
# (Intercept)   3.4052     0.7302    4.66  3.1e-06
# log(Hits)    -0.3000     0.0549   -5.46  4.7e-08
Average hits (hits over the product’s lifetime) turns out to be even more important:
#              Estimate Std. Error z value Pr(>|z|)
# (Intercept)    -2.297      1.586   -1.45    0.147
# log(Hits)       0.511      0.209    2.44    0.015
# log(AvgHits)   -0.852      0.217   -3.93  8.3e-05
This is more than a little strange; the higher the average hits, the less likely to be killed makes perfect sense but then, surely the higher the hits, the less likely as well? But no. The mystery deepens as we bring in the third hit metric we developed:
#                   Estimate Std. Error z value Pr(>|z|)
# (Intercept)        -21.589     11.955   -1.81   0.0709
# log(Hits)            2.054      0.980    2.10   0.0362
# log(AvgHits)        -1.921      0.708   -2.71   0.0067
# log(DeflatedHits)   -0.456      0.277   -1.64   0.1001
And sure enough, if we run all 4 hit variables, 3 of them turn out to be statistically-significant and large:
#                   Estimate Std. Error z value Pr(>|z|)
# (Intercept)       -24.6898    12.4696   -1.98   0.0477
# log(Hits)           2.2908     1.0203    2.25   0.0248
# log(AvgHits)       -2.0943     0.7405   -2.83   0.0047
# log(DeflatedHits)  -0.5383     0.2914   -1.85   0.0647
# AvgDeflatedHits    -0.0651     0.0605   -1.08   0.2819
It’s not that the hit variables are somehow summarizing or proxying for the others, because if we toss in all the non-hits predictors and penalize parameters based on adding complexity without increasing fit, we still wind up with the 3 hit variables:
#                   Estimate Std. Error z value Pr(>|z|)
# (Intercept)        -23.341     12.034   -1.94   0.0524
# AcquisitionTRUE      0.631      0.350    1.80   0.0712
# SocialTRUE           0.907      0.394    2.30   0.0213
# log(Hits)            2.204      0.985    2.24   0.0252
# log(AvgHits)        -2.068      0.713   -2.90   0.0037
# log(DeflatedHits)   -0.492      0.280   -1.75   0.0793
# ...
# AIC: 396.9
Most of the predictors were removed as not helping a lot, 3 of the 4 hit variables survived (but not the both averaged & deflated hits, suggesting it wasn’t adding much in combination), and we see two of the better predictors from earlier survived: whether something was an acquisition and whether it was social.
The original hits variable has the wrong sign, as expected of data leakage; now the average and deflated hits have the predicted sign (the higher the hit count, the lower the risk of death), but this doesn’t put to rest my concerns: the average hits has the right sign, yes, but now the effect size seems way too high - we reject the hits with a log-odds of +2.1 as contaminated and a correlation almost 4 times larger than one of the known-good correlations (being an acquisition), but the average hits is -2 & almost as big a log odds! The only variable which seems trustworthy is the deflated hits: it has the right sign and is a more plausible 5x smaller. I’ll use just the deflated hits variable (although I will keep in mind that I’m still not sure it is free from data leakage).
Survival Curve
The logistic regression helped winnow down the variables but is limited to the binary outcome of shutdown or not; it can’t use the potentially very important variable of how many days a product has survived for the simple reason that of course mortality will increase with time! (“But this long run is a misleading guide to current affairs. In the long run we are all dead.”)
For looking at survival over time, survival analysis might be a useful elaboration. Not being previously familiar with the area, I drew on Wikipedia, Fox & Weisberg’s appendix, Bewick et al 2004, Zhou’s tutorial, and Hosmer & Lemeshow’s Applied Survival Analysis for the following results using the survival library (see also CRAN Task View: Survival Analysis, and the taxonomy of survival analysis methods in Wang et al 2017). Any errors are mine.
The initial characterization gives us an optimistic median of 2824 days (note that this is higher than Arthur’s mean of 1459 days because it addressed the conditionality issue discussed earlier by including products which were never canceled, and I made a stronger effort to collect pre-2009 products), but the lower bound is not tight and too little of the sample has died to get an upper bound:
# records   n.max n.start  events  median 0.95LCL 0.95UCL
#     350     350     350     123    2824    2095      NA
Our overall Kaplan-Meier survivorship curve looks a bit interesting:
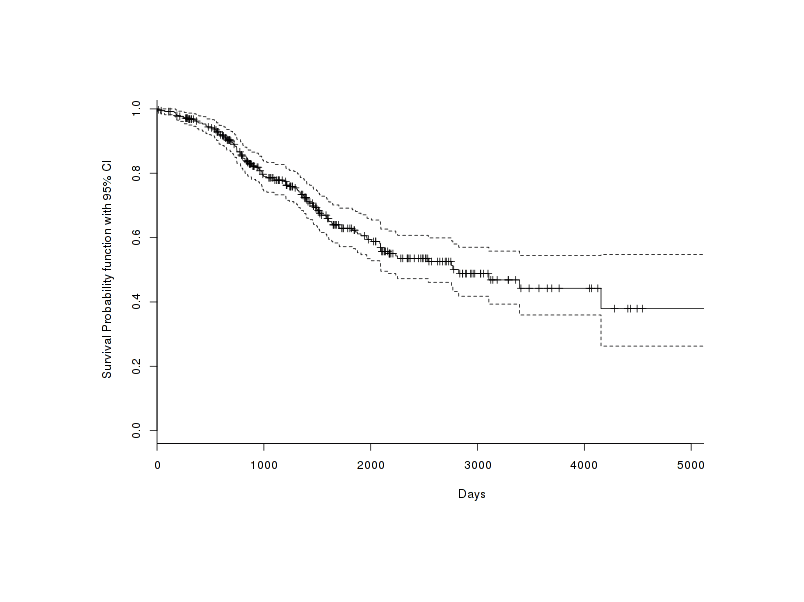
Shutdown cumulative probability as a function of time
If there were constant mortality of products at each day after their launch, we would expect a “type II” curve where it looks like a straight line, and if the hazard increased with age like with humans we would see a “type I” graph in which the curve nose-dives; but in fact it looks like there’s a sort of “leveling off” of deaths, suggesting a “type III” curve; per Wikipedia:
…the greatest mortality is experienced early on in life, with relatively low rates of death for those surviving this bottleneck. This type of curve is characteristic of species that produce a large number of offspring (see r/K selection theory).
Very nifty: the survivorship curve is consistent with tech industry or startup philosophies of doing lots of things, iterating fast, and throwing things at the wall to see what sticks. (More pleasingly, it suggests that my dataset is not biased against the inclusion of short-lived products: if I had been failing to find a lot of short-lived products, then we would expect to see the true survivorship curve distorted into something of a type II or type I curve and not a type III curve where a lot of products are early deaths; so if there were a data collection bias against short-lived products, then the true survivorship curve must be even more extremely type III.)
However, it looks like the mortality only starts decreasing around 2,000 days, so any product that far out must have been founded around or before 200521ya, which is when we previously noted that Google started pumping out a lot of products and may also have changed its shutdown-related behaviors; this could violate a basic assumption of Kaplan-Meier, that the underlying survival function isn’t itself changing over time.
Our next step is to fit a Cox proportional hazards model to our covariates:
# ...n= 350, number of events= 123
#
#                     coef exp(coef) se(coef)     z Pr(>|z|)
# AcquisitionTRUE    0.130     1.139    0.257  0.51    0.613
# FLOSSTRUE          0.141     1.151    0.293  0.48    0.630
# ProfitTRUE        -0.180     0.836    0.231 -0.78    0.438
# SocialTRUE         0.664     1.943    0.262  2.53    0.011
# Typeprogram        0.957     2.603    0.747  1.28    0.200
# Typeservice        1.291     3.638    0.725  1.78    0.075
# Typething          1.682     5.378    1.023  1.64    0.100
# log(DeflatedHits) -0.288     0.749    0.036 -8.01  1.2e-15
#
#                   exp(coef) exp(-coef) lower .95 upper .95
# AcquisitionTRUE       1.139      0.878     0.688     1.884
# FLOSSTRUE             1.151      0.868     0.648     2.045
# ProfitTRUE            0.836      1.197     0.531     1.315
# SocialTRUE            1.943      0.515     1.163     3.247
# Typeprogram           2.603      0.384     0.602    11.247
# Typeservice           3.637      0.275     0.878    15.064
# Typething             5.377      0.186     0.724    39.955
# log(DeflatedHits)     0.749      1.334     0.698     0.804
#
# Concordance= 0.726  (se = 0.028 )
# Rsquare= 0.227   (max possible= 0.974 )
# Likelihood ratio test= 90.1  on 8 df,   p=4.44e-16
# Wald test            = 79.5  on 8 df,   p=6.22e-14
# Score (logrank) test = 83.5  on 8 df,   p=9.77e-15
And then we can also test whether any of the covariates are suspicious; in general they seem to be fine:
#                       rho  chisq     p
# AcquisitionTRUE   -0.0252 0.0805 0.777
# FLOSSTRUE          0.0168 0.0370 0.848
# ProfitTRUE        -0.0694 0.6290 0.428
# SocialTRUE         0.0279 0.0882 0.767
# Typeprogram        0.0857 0.9429 0.332
# Typeservice        0.0936 1.1433 0.285
# Typething          0.0613 0.4697 0.493
# log(DeflatedHits) -0.0450 0.2610 0.609
# GLOBAL                 NA 2.5358 0.960
My suspicion lingers, though, so I threw in another covariate (EarlyGoogle): whether a product was released before or after 200521ya. Does this add predictive value above and over simply knowing that a product is really old, and does the regression still pass the proportional assumption check? Apparently yes to both:
#                      coef exp(coef) se(coef)     z Pr(>|z|)
# AcquisitionTRUE    0.1674    1.1823   0.2553  0.66    0.512
# FLOSSTRUE          0.1034    1.1090   0.2922  0.35    0.723
# ProfitTRUE        -0.1949    0.8230   0.2318 -0.84    0.401
# SocialTRUE         0.6541    1.9233   0.2601  2.51    0.012
# Typeprogram        0.8195    2.2694   0.7472  1.10    0.273
# Typeservice        1.1619    3.1960   0.7262  1.60    0.110
# Typething          1.6200    5.0529   1.0234  1.58    0.113
# log(DeflatedHits) -0.2645    0.7676   0.0375 -7.06  1.7e-12
# EarlyGoogleTRUE   -1.0061    0.3656   0.5279 -1.91    0.057
# ...
# Concordance= 0.728  (se = 0.028 )
# Rsquare= 0.237   (max possible= 0.974 )
# Likelihood ratio test= 94.7  on 9 df,   p=2.22e-16
# Wald test            = 76.7  on 9 df,   p=7.2e-13
# Score (logrank) test = 83.8  on 9 df,   p=2.85e-14
# rho chisq p
# ...
# EarlyGoogleTRUE -0.05167 0.51424 0.473
# GLOBAL NA 2.52587 0.980As predicted, the pre-2005 variable does indeed correlate to less chance of being shutdown, is the third-largest predictor, and almost reaches a random16 level of statistical-significance - but it doesn’t trigger the assumption tester, so we’ll keep using the Cox model.
Now let’s interpret the model. The covariates tell us that to reduce the risk of shutdown, you want to:
Not be an acquisition
Not be FLOSS
Be directly making money
Not be related to social networking
Have lots of Google hits relative to lifetime
Have been launched early in Google’s lifetime
This all makes sense to me. I find particularly interesting the profit and social effects, but the odds are a little hard to understand intuitively; if being social increases the odds of shutdown by 1.9233 and not being directly profitable increases the odds by 1.215, what do those look like? We can graph pairs of survivorship curves, splitting the full dataset (omitting the confidence intervals for legibility, although they do overlap), to get a grasp of what these numbers mean:
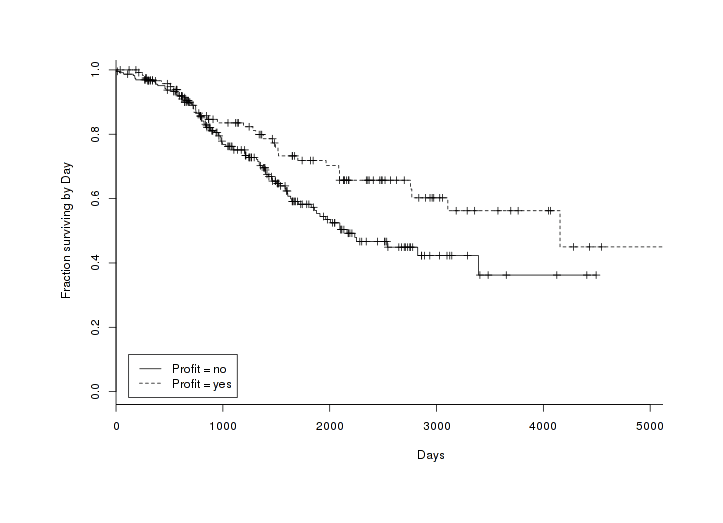
All products over time, split by Profit variable
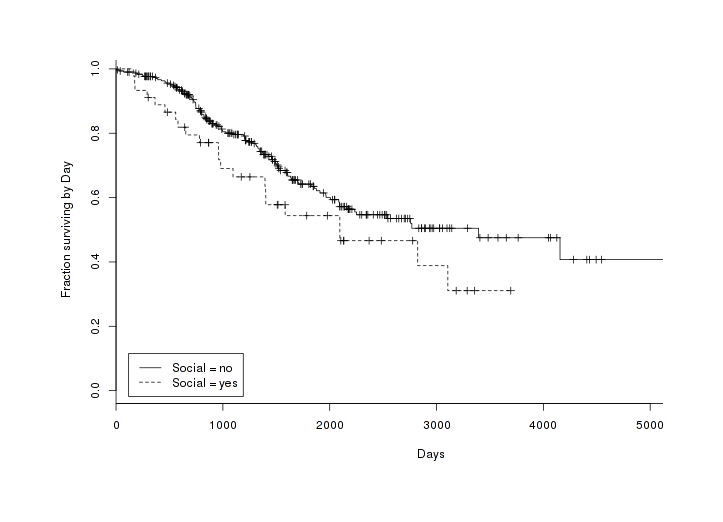
All products over time, split by Social variable
Random Forests
Because I can, I was curious how random forests (Breiman 2001) might stack up to the logistic regression and against a base-rate predictor (that nothing was shut down, since ~65% of the products are still alive).
With randomForest, I trained a random forest as a classifier, yielding reasonable looking error rates:
#                Type of random forest: classification
#                      Number of trees: 500
# No. of variables tried at each split: 2
#
#         OOB estimate of  error rate: 31.71%
# Confusion matrix:
#       FALSE TRUE class.error
# FALSE   216   11     0.04846
# TRUE    100   23     0.81301
To compare the random forest accuracy with the logistic model’s accuracy, I interpreted the logistic estimate of shutdown odds >1 as predicting shutdown and <1 as predicting not shutdown; I then compared the full sets of predictions with the actual shutdown status. (This is not a proper scoring rule like those I employed in grading forecasts of the 2012 American elections, but this should be an intuitively understandable way of grading models’ predictions.)
The base-rate predictor got 65% right by definition, the logistic managed to score 68% correct (bootstrap17 95% CI: 66-72%), and the random forest similarly got 68% (67-78%). These rates are not quite as bad as they may seem: I excluded the lifetime length (Days) from the logistic and random forests because unless one is handling it specially with survival analysis, it leaks information; so there’s predictive power being left on the table. A fairer comparison would use lifetimes.
Random Survival Forests
The next step is to take into account lifetime length & estimated survival curves. We can do that using “Random survival forests” (see also “Mogensen et al 2012”), implemented in randomForestSRC (successor to Ishwaran’s original library randomSurvivalForest). This initially seems very promising:
#                          Sample size: 350
#                     Number of deaths: 122
#                      Number of trees: 1000
#           Minimum terminal node size: 3
#        Average no. of terminal nodes: 61.05
# No. of variables tried at each split: 3
#               Total no. of variables: 7
#                             Analysis: Random Forests [S]RC
#                               Family: surv
#                       Splitting rule: logrank *random*
#        Number of random split points: 1
#               Estimate of error rate: 35.37%
and even gives us a cute plot of how accuracy varies with how big the forest is (looks like we don’t need to tweak it) and how important each variable is as a predictor:
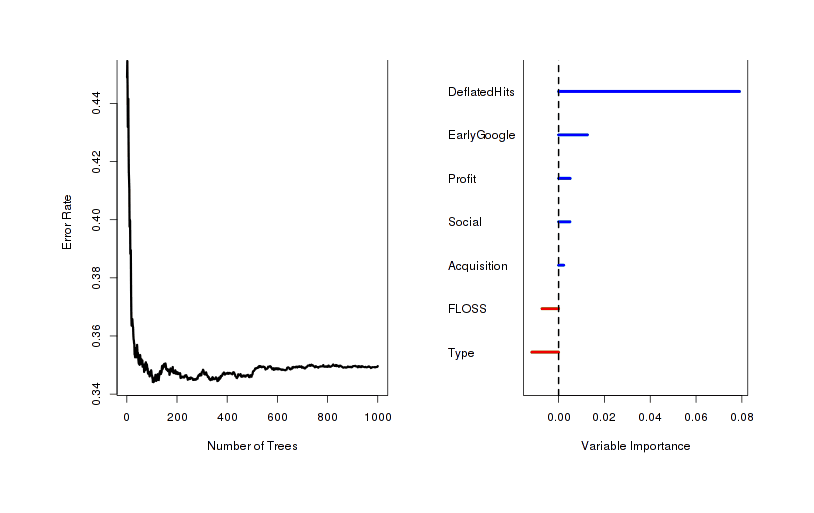
Visual comparison of the average usefulness of each variable to decision trees
Estimating the error rate for this random survival forest like we did previously, we’re happy to see a 78% error rate. Building a predictor based on the Cox model, we get a lesser (but still better than the non-survival models) 72% error rate.
How do these models perform when we check their robustness via the bootstrap? Not so great. The random survival forest collapses to 57-64% (95% on 200 replicates), but the Cox model just to 68-73%. This suggests to me that something is going wrong with the random survival forest model (overfitting? programming error?) and there’s no real reason to switch to the more complex random forests, so here too we’ll stick with the ordinary Cox model.
Predictions
Before making explicit predictions of the future, let’s look at the relative risks for products which haven’t been shutdown. What does the Cox model consider the 10 most at risk and likely to be shutdown products?
It lists (in decreasingly risky order):
Schemer
Boutiques
Magnifier
Hotpot
Page Speed Online API
WhatsonWhen
Unofficial Guides
WDYL search engine
Cloud Messaging
Correlate
These all seem like reasonable products to signal out (as much as I love Correlate for making it easier than ever to demonstrate “correlation ≠ causation”, I’m surprised it or Boutiques still exist), except for Cloud Messaging which seems to be a key part of a lot of Android. And likewise, the list of the 10 least risky (increasingly risky order):
Search
Translate
AdWords
Picasa
Groups18
Image Search
News
Books
Toolbar
AdSense
One can’t imagine flagship products like Search or Books ever being shut down, so this list is good as far as it goes; I am skeptical about the actual unriskiness of Picasa and Toolbar given their general neglect and old-fashionedness, though I understand why the model favors them (both are pre-2005, proprietary, many hits, and advertising-supported). But let’s get more specific; looking at still alive services, what predictions do we make about the odds of a selected batch surviving the next, say, 5 years? We can derive a survival curve for each member of the batch adjusted for each subject’s covariates (and they visibly differ from each other):
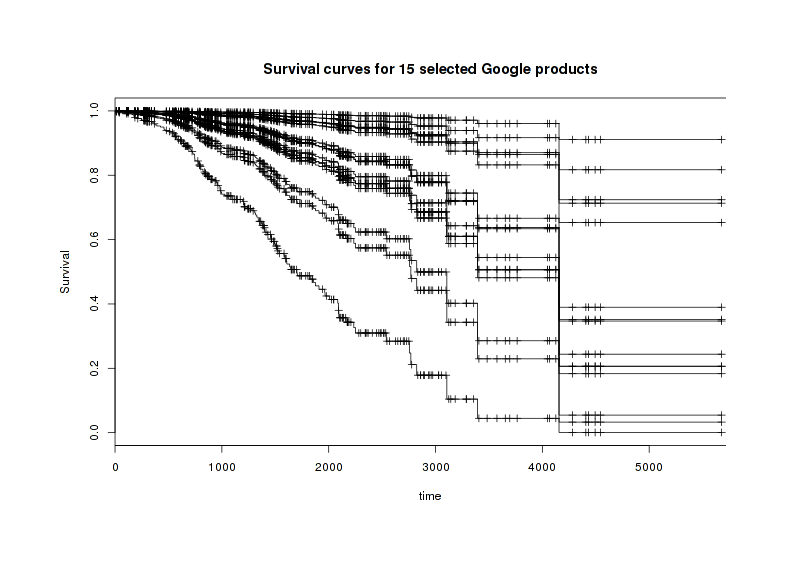
Estimated curves for 15 interesting products (AdSense, Scholar, Voice, etc.)
But these are the curves for hypothetical populations all like the specific product in question, starting from Day 0. Can we extract specific estimates assuming the product has survived to today (as by definition these live services have done)? Yes, but extracting them turns out to be a pretty gruesome hack to extract predictions from survival curves; anyway, I derive the following 5-year estimates and as commentary, register my own best guesses as well (I’m not too bad at making predictions):
Product |
5-year survival |
Personal guess |
Relative risk vs average (lower=better) |
Survived (March 2018) |
|---|---|---|---|---|
AdSense |
100% |
0.07 |
Yes |
|
Blogger |
100% |
0.32 |
Yes |
|
Gmail |
96% |
0.08 |
Yes |
|
Search |
96% |
0.05 |
Yes |
|
Translate |
92% |
0.78 |
Yes |
|
Scholar |
92% |
0.10 |
Yes |
|
Alerts |
89% |
0.21 |
Yes |
|
Google+ |
79% |
0.36 |
Yes19 |
|
Analytics |
76% |
0.24 |
Yes |
|
Chrome |
70% |
0.24 |
Yes |
|
Calendar |
66% |
0.36 |
Yes |
|
Docs |
63% |
0.39 |
Yes |
|
Voice20 |
44% |
0.78 |
Yes |
|
FeedBurner |
43% |
0.66 |
Yes |
|
Project Glass |
37% |
0.10 |
No |
One immediately spots that some of the model’s estimates seem questionable in the light of our greater knowledge of Google.
I am more pessimistic about the much-neglected Alerts. And I think it’s absurd to give any serious credence Analytics or Calendar or Docs being at risk (Analytics is a key part of the advertising infrastructure, and Calendar a sine qua non of any business software suite - much less the core of said suite, Docs!). The Glass estimate is also interesting: I don’t know if I agree with the model, given how famous Glass is and how much Google is pushing it - could its future really be so chancy? On the other hand, many tech fads have come and go without a trace, hardware is always tricky, the more intimate a gadget the more design matters (Glass seems like the sort of thing Apple could make a blockbuster, but can Google?), Glass has already received a hefty helping of criticism, particularly the man most experienced with such HUDs (Steve Mann) has criticized Glass as being “much less ambitious” than the state-of-the-art and worries that “Google and certain other companies are neglecting some important lessons. Their design decisions could make it hard for many folks to use these systems. Worse, poorly configured products might even damage some people’s eyesight and set the movement back years. My concern comes from direct experience.”
But some estimates are more forgivable - Google does have a bad track record with social media so some level of skepticism about Google+ seems warranted (and indeed, in October 2018 Google quietly announced public Google+ would be shut down & henceforth only an enterprise product) - and on FeedBurner or Voice, I agree with the model that their future is cloudy. The extreme optimism about Blogger is interesting since before I began this project, I thought it was slowly dying and would inevitably shut down in a few years; but as I researched the timelines for various Google products, I noticed that Blogger seems to be favored in some ways: such as getting exclusive access to a few otherwise shutdown things (eg. Scribe & Friend Connect); it was the ground zero for Google’s Dynamic Views skin redesign which was applied globally; and Google is still heavily using Blogger for all its official announcements even into the Google+ era.
Overall, these are pretty sane-sounding estimates.
Followups
Show me the person who doesn’t die—
death remains impartial.
I recall a towering man
who is now a pile of dust.
The World Below knows no dawn
though plants enjoy another spring;
those visiting this sorrowful place
the pine wind slays with grief.Han-Shan, #50
It seems like it might be worthwhile to continue compiling a database and do a followup analysis in 5 years (2018), by which point we can judge how my predictions stacked up against the model, and also because ~100 products may have been shut down (going by the >30 casualties of 201115ya and 201214ya) and the survival curve & covariate estimates rendered that much sharper. So to compile updates, I’ve:
set up 2 Google Alerts searches:
google ("shut down" OR "shut down" "shutting" OR "closing" OR "killing" OR "abandoning" OR "leaving")google (launch OR release OR announce)
and subscribed to the aforementioned Google Operating System blog
These sources yielded ~64 candidates over the following year before I shut down additions 2014-06-04.
See Also
External Links
“Google Memorial, le petit musée des projets Google abandonnés”
“A very brief history of every Google messaging app: What a decade and a half of confusing services can tell us about the future”; “A decade and a half of instability: The history of Google messaging apps: 16 years after the launch of Google Talk, Google messaging is still a mess”
Discussion:
Media coverage:
Acquisition background:
Appendix
Source Code
Run as R --slave --file=google.r:
set.seed(7777) # for reproducible numbers

library(survival)
library(randomForest)
library(boot)
library(randomForestSRC)
library(prodlim) # for 'sindex' call
library(rms)

# Generate Google corpus model for use in main analysis
# Load the data, fit, and plot:
index <- read.csv("https://gwern.net/doc/statistics/2013-google-index.csv",
                   colClasses=c("Date","double","character"))
# an exponential doesn't fit too badly:
model1 <- lm(log(Size) ~ Date, data=index); summary(model1)
# plot logged size data and the fit:
png(file="~/wiki/doc/technology/google/gwern-www-index-model.png", width = 3*480, height = 1*480)
plot(log(index$Size) ~ index$Date, ylab="WWW index size", xlab="Date")
abline(model1)
invisible(dev.off())

# Begin actual data analysis
google <- read.csv("https://gwern.net/doc/statistics/survival-analysis/2013-google.csv",
                    colClasses=c("character","logical","Date","Date","double","factor",
                                 "logical","logical","logical","logical", "integer",
                                 "numeric", "numeric", "numeric", "logical", "numeric",
                                 "numeric", "numeric", "numeric"))
# google$Days <- as.integer(google$Ended - google$Started)
# derive all the Google index-variables
## hits per day to the present
# google$AvgHits <- google$Hits / as.integer(as.Date("2013-04-01") - google$Started)
## divide total hits for each product by total estimated size of Google index when that product started
# google$DeflatedHits <- log(google$Hits / exp(predict(model1, newdata=data.frame(Date = google$Started))))
## Finally, let's combine the two strategies: deflate and then average.
# google$AvgDeflatedHits <- log(google$AvgHits) / google$DeflatedHits
# google$DeflatedHits <- log(google$DeflatedHits)

cat("\nOverview of data:\n")
print(summary(google[-1]))

dead <- google[google$Dead,]

png(file="~/wiki/doc/technology/google/gwern-openedvslifespan.png", width = 1.5*480, height = 1*480)
plot(dead$Days ~ dead$Ended, xlab="Shutdown", ylab="Total lifespan")
invisible(dev.off())

png(file="~/wiki/doc/technology/google/gwern-shutdownsbyyear.png", width = 1.5*480, height = 1*480)
hist(dead$Ended, breaks=seq.Date(as.Date("2005-01-01"), as.Date("2014-01-01"), "years"),
                   main="shutdowns per year", xlab="Year")
invisible(dev.off())
png(file="~/wiki/doc/technology/google/gwern-shutdownsbyyear-kernel.png", width = 1*480, height = 1*480)
plot(density(as.numeric(dead$Ended)), main="Shutdown kernel density over time")
invisible(dev.off())

png(file="~/wiki/doc/technology/google/gwern-startsbyyear.png", width = 1.5*480, height = 1*480)
hist(google$Started, breaks=seq.Date(as.Date("1997-01-01"), as.Date("2014-01-01"), "years"),
     xlab="total products released in year")
invisible(dev.off())

# extract the month of each kill
m = months(dead$Ended)
# sort by chronological order, not alphabetical
m_fac = factor(m, levels = month.name)
# count by month
months <- table(sort(m_fac))
# shutdowns by month are imbalanced:
print(chisq.test(months))
# and visibly so:
png(file="~/wiki/doc/technology/google/gwern-shutdownsbymonth.png", width = 1.5*480, height = 1*480)
plot(months)
invisible(dev.off())

cat("\nFirst logistic regression:\n")
print(summary(glm(Dead ~ Type + Profit + FLOSS + Acquisition + Social + log(Hits),
                  data=google, family="binomial")))

cat("\nSecond logistic regression, focusing on treacherous hit data:\n")
print(summary(glm(Dead ~ log(Hits), data=google,family="binomial")))
cat("\nTotal + average:\n")
print(summary(glm(Dead ~ log(Hits) + log(AvgHits), data=google,family="binomial")))
cat("\nTotal, average, deflated:\n")
print(summary(glm(Dead ~ log(Hits) + log(AvgHits) + DeflatedHits, data=google,family="binomial")))
cat("\nAll:\n")
print(summary(glm(Dead ~ log(Hits) + log(AvgHits) + DeflatedHits + AvgDeflatedHits,
                  data=google, family="binomial")))
cat("\nStepwise regression through possible logistic regressions involving the hit variables:\n")
print(summary(step(glm(Dead ~ Type + Profit + FLOSS + Acquisition + Social +
                        log(Hits) + log(AvgHits) + DeflatedHits + AvgDeflatedHits,
                       data=google, family="binomial"))))

cat("\nEntering survival analysis section:\n")

cat("\nUnconditional Kaplan-Meier survival curve:\n")
surv <- survfit(Surv(google$Days, google$Dead, type="right") ~ 1)
png(file="~/wiki/doc/technology/google/gwern-overall-survivorship-curve.png", width = 1.5*480, height = 1*480)
plot(surv, xlab="Days", ylab="Survival Probability function with 95% CI")
invisible(dev.off())

cat("\nCox:\n")
cmodel <- coxph(Surv(Days, Dead) ~ Acquisition + FLOSS + Profit + Social + Type + DeflatedHits,
                data = google)
print(summary(cmodel))
cat("\nTest proportional assumption:\n")
print(cox.zph(cmodel))

cat("\nPrimitive check for regime change (re-regress & check):\n")
google$EarlyGoogle <- (as.POSIXlt(google$Started)$year+1900) < 2005
cmodel <- coxph(Surv(Days, Dead) ~ Acquisition + FLOSS + Profit + Social + Type +
                                   DeflatedHits + EarlyGoogle,
                data = google)
print(summary(cmodel))
print(cox.zph(cmodel))

cat("\nGenerating intuitive plots of social & profit;\n")
cat("\nPlot empirical survival split by profit...\n")
png(file="~/wiki/doc/technology/google/gwern-profit-survivorship-curve.png", width = 1.5*480, height = 1*480)
smodel1 <- survfit(Surv(Days, Dead) ~ Profit, data = google);
plot(smodel1, lty=c(1, 2), xlab="Days", ylab="Fraction surviving by Day");
legend("bottomleft", legend=c("Profit = no", "Profit = yes"), lty=c(1 ,2), inset=0.02)
invisible(dev.off())

cat("\nSplit by social...\n")
smodel2 <- survfit(Surv(Days, Dead) ~ Social, data = google)
png(file="~/wiki/doc/technology/google/gwern-social-survivorship-curve.png", width = 1.5*480, height = 1*480)
plot(smodel2, lty=c(1, 2), xlab="Days", ylab="Fraction surviving by Day")
legend("bottomleft", legend=c("Social = no", "Social = yes"), lty=c(1 ,2), inset=0.02)
invisible(dev.off())

cat("\nTrain some random forests for prediction:\n")
lmodel <- glm(Dead ~ Acquisition + FLOSS + Profit + Social + Type +
                     DeflatedHits + EarlyGoogle + Days,
                   data=google, family="binomial")
rf <- randomForest(as.factor(Dead) ~ Acquisition + FLOSS + Profit + Social +
                                     Type + DeflatedHits + EarlyGoogle,
                   importance=TRUE, data=google)
print(rf)
cat("\nVariables by importance for forests:\n")
print(importance(rf))

cat("\nBase-rate predictor of ~65% products alive:\n")
print(sum(FALSE == google$Dead) / nrow(google))
cat("\nLogistic regression's correct predictions:\n")
print(sum((exp(predict(lmodel))>1) == google$Dead) / nrow(google))
cat("\nRandom forest's correct predictions:\n")
print(sum((as.logical(predict(rf))) == google$Dead) / nrow(google))

cat("\nBegin bootstrap test of predictive accuracy...\n")
cat("\nGet a subsample, train logistic regression on it, test accuracy on original Google data:\n")
logisticPredictionAccuracy <- function(gb, indices) {
  g <- gb[indices,] # allows boot to select subsample
  # train new regression model on subsample
  lmodel <- glm(Dead ~ Acquisition + FLOSS + Profit + Social + Type +
                       DeflatedHits + EarlyGoogle + Days,
                   data=g, family="binomial")
  return(sum((exp(predict(lmodel, newdata=google))>1) == google$Dead) / nrow(google))
}
lbs <- boot(data=google, statistic=logisticPredictionAccuracy, R=20000, parallel="multicore", ncpus=4)
print(boot.ci(lbs, type="norm"))

cat("\nDitto for random forests:\n")
randomforestPredictionAccuracy <- function(gb, indices) {
  g <- gb[indices,]
  rf <- randomForest(as.factor(Dead) ~ Acquisition + FLOSS + Profit + Social + Type +
                       DeflatedHits + EarlyGoogle + Days,
                   data=g)
  return(sum((as.logical(predict(rf))) == google$Dead) / nrow(google))
}
rfbs <- boot(data=google, statistic=randomforestPredictionAccuracy, R=20000, parallel="multicore", ncpus=4)
print(boot.ci(rfbs, type="norm"))

cat("\nFancier comparison: random survival forests and full Cox model with bootstrap\n")
rsf <- rfsrc(Surv(Days, Dead) ~ Acquisition + FLOSS + Profit + Social + Type + DeflatedHits + EarlyGoogle,
             data=google, nsplit=1)
print(rsf)

png(file="~/wiki/doc/technology/google/gwern-rsf-importance.png", width = 1.5*480, height = 1*480)
plot(rsf)
invisible(dev.off())

# calculate cumulative hazard function; adapted from Mogensen et al 2012 (I don't understand this)
predictSurvProb.rsf <- function (object, newdata, times, ...) {
    N <- NROW(newdata)
    # class(object) <- c("rsf", "grow")
    S <- exp(-predict.rfsrc(object, test = newdata)$chf)
    if(N == 1) S <- matrix(S, nrow = 1)
    Time <- object$time.interest
    p <- cbind(1, S)[, 1 + sindex(Time, times),drop = FALSE]
    if(NROW(p) != NROW(newdata) || NCOL(p) != length(times))
     stop("Prediction failed")
    p
}
totals <- as.integer(as.Date("2013-04-01") - google$Started)
randomSurvivalPredictionAccuracy <- function(gb, indices) {
    g <- gb[indices,]
    rsfB <- rfsrc(Surv(Days, Dead) ~ Acquisition + FLOSS + Profit + Social + Type +
                                     DeflatedHits + EarlyGoogle,
                 data=g, nsplit=1)

    predictionMatrix <- predictSurvProb.rsf(rsfB, google, totals)
    rm(predictions)
    for (i in 1:nrow(google)) { predictions[i] <- predictionMatrix[i,i] }

    return(sum((predictions<0.50) == google$Dead) / nrow(google))
}
# accuracy on full Google dataset
print(randomSurvivalPredictionAccuracy(google, 1:nrow(google)))
# check this high accuracy using bootstrap
rsfBs <- boot(data=google, statistic=randomSurvivalPredictionAccuracy, R=200, parallel="multicore", ncpus=4)
print(rsfBs)
print(boot.ci(rsfBs, type="perc"))

coxProbability <- function(cm, d, t) {
    x <- survfit(cm, newdata=d)
    p <- x$surv[Position(function(a) a>t, x$time)]
    if (is.null(p)) { coxProbability(d, (t-1)) } else {if (is.na(p)) p <- 0}
    p
    }
randomCoxPredictionAccuracy <- function(gb, indices) {
    g <- gb[indices,]
    cmodel <- cmodel <- coxph(Surv(Days, Dead) ~ Acquisition + FLOSS + Profit + Social + Type + DeflatedHits,
                data = g)

    rm(predictions)
    for (i in 1:nrow(google)) { predictions[i] <- coxProbability(cmodel, google[i,], totals[i]) }

    return(sum((predictions<0.50) == google$Dead) / nrow(google))
    }
print(randomCoxPredictionAccuracy(google, 1:nrow(google)))
coxBs <- boot(data=google, statistic=randomCoxPredictionAccuracy, R=200, parallel="multicore", ncpus=4)
print(coxBs)
print(boot.ci(coxBs, type="perc"))

cat("\nRanking products by Cox risk ratio...\n")
google$RiskRatio <- predict(cmodel, type="risk")
alive <- google[!google$Dead,]

cat("\nExtract the 10 living products with highest estimated relative risks:\n")
print(head(alive[order(alive$RiskRatio, decreasing=TRUE),], n=10)$Product)

cat("\nExtract the 10 living products with lowest estimated relative risk:\n")
print(head(alive[order(alive$RiskRatio, decreasing=FALSE),], n=10)$Product)

cat("\nBegin calculating specific numerical predictions about remaining lifespans..\n")
cpmodel <- cph(Surv(Days, Dead) ~ Acquisition + FLOSS + Profit + Social + Type +
                                  DeflatedHits + EarlyGoogle,
               data = google, x=TRUE, y=TRUE, surv=TRUE)
predictees <- subset(google, Product %in% c("Alerts","Blogger","FeedBurner","Scholar",
                                            "Book Search","Voice","Gmail","Analytics",
                                            "AdSense","Calendar","Alerts","Google+","Docs",
                                            "Search", "Project Glass", "Chrome", "Translate"))
# seriously ugly hack
conditionalProbability <- function (d, followupUnits) {
    chances <- rep(NA, nrow(d)) # stash results

    for (i in 1:nrow(d)) {

        # extract chance of particular subject surviving as long as it has:
        beginProb <- survest(cpmodel, d[i,], times=(d[i,]$Days))$surv
        if (length(beginProb)==0) { beginProb <- 1 } # set to a default

        tmpFollowup <- followupUnits # reset in each for loop
        while (TRUE) {
            # extract chance of subject surviving as long as it has + an arbitrary additional time-units
            endProb <- survest(cpmodel, d[i,], times=(d[i,]$Days + tmpFollowup))$surv
            # survival curve may not reach that far! 'survexp returns 'numeric(0)' if it doesn't;
            # so we shrink down 1 day and try again until 'survexp' *does* return an usable answer
            if (length(endProb)==0) { tmpFollowup <- tmpFollowup - 1} else { break }
        }

        # if 50% of all subjects survive to time t, and 20% of all survive to time t+100, say, what chance
        # does a survivor - at exactly time t - have of making it to time t+100? 40%: 0.20 / 0.50 = 0.40
        chances[i] <- endProb / beginProb
    }
    return(chances)
}
## the risks and survival estimate have been stashed in the original CSV to save computation
# google$RelativeRisk <- predict(cmodel, newdata=google, type="risk")
# google$LinearPredictor <- predict(cmodel, newdata=google, type="lp")
# google$ExpectedEvents <- predict(cmodel, newdata=google, type="expected")
# google$FiveYearSurvival <- conditionalProbability(google, 5*365.25)

# graphs survival curves for each of the 15
png(file="~/wiki/doc/technology/google/gwern-15-predicted-survivorship-curves.png", width = 1.5*480, height = 1*480)
plot(survfit(cmodel, newdata=predictees),
     xlab = "time", ylab="Survival", main="Survival curves for 15 selected Google products")
invisible(dev.off())
cat("\nPredictions for the 15 and also their relative risks:\n")
ps <- conditionalProbability(predictees, 5*365.25)
print(data.frame(predictees$Product, ps*100))
print(round(predict(cmodel, newdata=predictees, type="risk"), digits=2))

# Analysis done

cat("\nOptimizing the generated graphs by cropping whitespace & losslessly compressing them...\n")
system(paste('cd ~/wiki/image/google/ &&',
             'for f in *.png; do convert "$f" -crop',
             '`nice convert "$f" -virtual-pixel edge -blur 0x5 -fuzz 10% -trim -format',
             '\'%wx%h%O\' info:` +repage "$f"; done'))
system("optipng -o9 -fix ~/wiki/image/google/*.png", ignore.stdout = TRUE)
Leakage
While the hit-counts are a possible form of leakage, I accidentally caused a clear case of leakage while seeing how random forests would do in predicting shutdowns.
One way to get data leakage is if we include the end-date; early on in my analysis I removed the Dead variable but it didn’t occur to me to remove the Ended date factor. The random forest would predict correctly every single shutdown except for 8, for an error-rate of 2%. How did it turn in this nearly-omniscient set of predictions and why did it get those 8 wrong? Because the 8 products are correctly marked in the original dataset as “dead” because their shutdown had been announced by Google, but had been scheduled by Google to die after the day I was running the code. So it turned out that the random forests were just emitting ‘dead’ for ‘anything with an end date before 2013-04-04’, and alive for everything thereafter!
library(randomForest)
rf <- randomForest(as.factor(Dead) ~ ., data=google[-1])
google[rf$predicted != google$Dead,]
#                      Product Dead    Started      Ended     Hits    Type Profit FLOSS Acquisition
# 24 Gmail Exchange ActiveSync TRUE 2009-02-09 2013-07-01   637000 service  FALSE FALSE       FALSE
# 30  CalDAV support for Gmail TRUE 2008-07-28 2013-09-16   245000 service  FALSE FALSE       FALSE
# 37                    Reader TRUE 2005-10-07 2013-07-01 79100000 service  FALSE FALSE       FALSE
# 38               Reader Play TRUE 2010-03-10 2013-07-01    43500 service  FALSE FALSE       FALSE
# 39                   iGoogle TRUE 2005-05-01 2013-11-01 33600000 service   TRUE FALSE       FALSE
# 74            Building Maker TRUE 2009-10-13 2013-06-01  1730000 service  FALSE FALSE       FALSE
# 75             Cloud Connect TRUE 2011-02-24 2013-04-30   530000 program  FALSE FALSE       FALSE
# 77   Search API for Shopping TRUE 2011-02-11 2013-09-16   217000 service   TRUE FALSE       FALSE
#    Social Days  AvgHits DeflatedHits AvgDeflatedHits
# 24  FALSE 1603   419.35    9.308e-06         -0.5213
# 30  FALSE 1876   142.86    4.823e-06         -0.4053
# 37   TRUE 2824 28868.61    7.396e-03         -2.0931
# 38  FALSE 1209    38.67    3.492e-07         -0.2458
# 39   TRUE 3106 11590.20    4.001e-03         -1.6949
# 74  FALSE 1327  1358.99    1.739e-05         -0.6583
# 75  FALSE  796   684.75    2.496e-06         -0.5061
# 77  FALSE  948   275.73    1.042e-06         -0.4080
# rf
# ...
#     Type of random forest: classification
#                      Number of trees: 500
# No. of variables tried at each split: 3
#
#         OOB estimate of  error rate: 2.29%
# Confusion matrix:
#       FALSE TRUE class.error
# FALSE   226    0     0.00000
# TRUE      8  115     0.06504
One sobering example I mention in my link rot page: 11% of Arab Spring-related tweets were gone within a year. I do not know what the full dimension of the Reader RSS archive loss will be.↩︎
Google Reader affords examples of this lack of transparency on a key issue - Google’s willingness to support Reader (extremely relevant to users, and even more so to the third-party web services and applications which relied on Reader to function); from BuzzFeed’s “Google’s Lost Social Network: How Google accidentally built a truly beloved social network, only to steamroll it with Google+. The sad, surprising story of Google Reader”:
The difficulty was that Reader users, while hyper-engaged with the product, never snowballed into the tens or hundreds of millions. Brian Shih became the product manager for Reader in the fall of 200818ya. “If Reader were its own startup, it’s the kind of company that Google would have bought. Because we were at Google, when you stack it up against some of these products, it’s tiny and isn’t worth the investment”, he said. At one point, Shih remembers, engineers were pulled off Reader to work on OpenSocial, a “half-baked” development platform that never amounted to much. “There was always a political fight internally on keeping people staffed on this little project”, he recalled. Someone hung a sign in the Reader offices that said “DAYS SINCE LAST THREAT OF CANCELLATION.” The number was almost always zero. At the same time, user growth - while small next to Gmail’s hundreds of millions - more than doubled under Shih’s tenure. But the “senior types”, as Bilotta remembers, “would look at absolute user numbers. They wouldn’t look at market saturation. So Reader was constantly on the chopping block.”
So when news spread internally of Reader’s gelding, it was like Hemingway’s line about going broke: “Two ways. Gradually, then suddenly.” Shih found out in the spring that Reader’s internal sharing functions - the asymmetrical following model, endemic commenting and liking, and its advanced privacy settings - would be superseded by the forthcoming Google+ model. Of course, he was forbidden from breathing a word to users.
Marco Arment says “I’ve heard from multiple sources that it effectively had a staff of zero for years”.↩︎
Shih further writes on Quora:
↩︎Let’s be clear that this has nothing to do with revenue vs operating costs. Reader never made money directly (though you could maybe attribute some of Feedburner and AdSense for Feeds usage to it), and it wasn’t the goal of the product. Reader has been fighting for approval/survival at Google since long before I was a PM for the product. I’m pretty sure Reader was threatened with de-staffing at least three times before it actually happened. It was often for some reason related to social:
2008 - let’s pull the team off to build OpenSocial
2009 - let’s pull the team off to build Buzz
2010 - let’s pull the team off to build Google+
It turns out they decided to kill it anyway in 201016ya, even though most of the engineers opted against joining G+. Ironically, I think the reason Google always wanted to pull the Reader team off to build these other social products was that the Reader team actually understood social (and tried a lot of experiments over the years that informed the larger social features at the company) [See Reader’s friends implementations v1, v2, and v3, comments, privacy controls, and sharing features. Actually wait, you can’t see those anymore, since they were all ripped out.]. Reader’s social features also evolved very organically in response to users, instead of being designed top-down like some of Google’s other efforts [Rob Fishman’s Buzzfeed article has good coverage of this: Google’s Lost Social Network]. I suspect that it survived for some time after being put into maintenance because they believed it could still be a useful source of content into G+. Reader users were always voracious consumers of content, and many of them filtered and shared a great deal of it. But after switching the sharing features over to G+ (the so called “share-pocalypse”) along with the redesigned UI, my guess is that usage just started to fall - particularly around sharing. I know that my sharing basically stopped completely once the redesign happened [Reader redesign: Terrible decision, or worst decision? I was a lot angrier then than I am now – now I’m just sad.]. Though Google did ultimately fix a lot of the UI issues, the sharing (and therefore content going into G+) would never recover. So with dwindling usefulness to G+, (likely) dwindling or flattening usage due to being in maintenance, and Google’s big drive to focus in the last couple of years, what choice was there but to kill the product?
The sign story is confirmed by another Googler; “Google Reader lived on borrowed time: creator Chris Wetherell reflects”:
↩︎“When they replaced sharing with +1 on Google Reader, it was clear that this day was going to come”, he said. Wetherell, 43, is amazed that Reader has lasted this long. Even before the project saw the light of the day, Google executives were unsure about the service and it was through sheer perseverance that it squeaked out into the market. At one point, the management team threatened to cancel the project even before it saw the light of the day, if there was a delay. “We had a sign that said, ‘days since cancellation’ and it was there from the very beginning”, added a very sanguine Wetherell. My translation: Google never really believed in the project. Google Reader started in 200521ya at what was really the golden age of RSS, blogging systems and a new content ecosystem. The big kahuna at that time was Bloglines (acquired by Ask.com) and Google Reader was an upstart.
The official PR release stated that too little usage was the reason Reader was being abandoned. Whether this is the genuine reason has been questioned by third parties, who observe that Reader seems to drive far more traffic than another service which Google had yet to ax, Google+; that one app had >2m users who also had Reader accounts; that just one alternative to Reader (Feedly) had in excess of 3 million signups post-announcement (reportedly, up to 4 million); and the largest of several petitions to Google reached 148k signatures (less, though, than the >1m downloads of the Android client). Given that few users will sign up at Feedly specifically, sign a petition, visit the BuzzFeed network, or use the apps in question, it seems likely that Reader had closer to 20m users than 2m users when its closure was announced. An unknown Google engineer has been quoted as saying in 2010 Reader had “tens of millions active monthly users”. Xoogler Jenna Bilotta (left Google November 2011) said
“I think the reason why people are freaking out about Reader is because that Reader did stick,” she said, noting the widespread surprise that Google would shut down such a beloved product. “The numbers, at least until I left, were still going up.”
The most popular feed on Google Reader in March 201313ya had 24.3m subscribers (some pixel-counting of an official user-count graph & inference from a leaked video suggests Reader in total may’ve had >36m users in Jan 201115ya). Jason Scott in 200917ya reminded us that this lack of transparency is completely predictable: “Since the dawn of time, companies have hired people whose entire job is to tell you everything is all right and you can completely trust them and the company is as stable as a rock, and to do so until they, themselves, are fired because the company is out of business.”↩︎
This would not come as news to Jason Scott of Archive Team, of course, but nevertheless James Fallows points out that when a cloud service evaporates, it’s simply gone and gives an interesting comparison:
↩︎Kevin Drum, in Mother Jones, on why the inability to rely on Google services is more disruptive than the familiar pre-cloud experience of having favorite programs get orphaned. My example is Lotus Agenda: it has officially been dead for nearly 20 years, but I can still use it (if I want, in a DOS session under the VMware Fusion Windows emulator on my Macs. Talk about layered legacy systems!). When a cloud program goes away, as Google Reader has done, it’s gone. There is no way you can keep using your own “legacy” copy, as you could with previous orphaned software.
From Gannes’s “Another Reason Google Reader Died: Increased Concern About Privacy and Compliance”
But at the same time, Google Reader was too deeply integrated into Google Apps to spin it off and sell it, like the company did last year with its SketchUp 3-D modeling software.
mattbarrie on Hacker News:
↩︎I’m here with Alan Noble who runs engineering at Google Australia and ran the Google Reader project until 18 months ago. They looked at open sourcing it but it was too much effort to do so because it’s tied to closely to Google infrastructure. Basically it’s been culled due to long term declining use.
The sheer size & dominance of some Google services have lead to comparisons to natural monopolies, such as the Economist column “Google’s Google problem”. I saw this comparison mocked, but it’s worth noting that at least one Googler made the same comparison years before. From Levy’s In the Plex 201115ya, part 7, section 2:
↩︎While some Googlers felt singled out unfairly for the attention, the more measured among them understood it as a natural consequence of Google’s increasing power, especially in regard to distributing and storing massive amounts of information. “It’s as if Google took over the water supply for the entire United States”, says Mike Jones, who handled some of Google’s policy issues. “It’s only fair that society slaps us around a little bit to make sure we’re doing the right thing.”
Specifically, this can be seen as a sort of issue of reducing deadweight loss: in some of the more successful acquisitions, Google’s modus operandi was to take a very expensive or highly premium service and make it completely free while also improving the quality. Analytics, Maps, Earth, Feedburner all come to mind as services whose predecessors (multiple, in the cases of Maps and Earth) charged money for their services (sometimes a great deal). This leads to deadweight loss as people do not use them, who would benefit to some degree but not to the full amount of the price (plus other factors like riskiness of investing time and money into trying it out). Google cites figures like billions of users over the years for several of these formerly-premium services, suggesting the gains from reduced deadweight loss are large.↩︎
If there is one truth of the tech industry, it’s that no giant (except IBM) survives forever. Death rates for all corporations and nonprofits are very high, but particularly so for tech. One blogger asks a good question:
↩︎As we come to rely more and more on the Internet, it’s becoming clear that there is a real threat posed by tying oneself to a 3rd party service. The Internet is famously designed to route around failures caused by a nuclear strike - but it cannot defend against a service being withdrawn or a company going bankrupt. It’s tempting to say that multi-billion dollar companies like Apple and Google will never disappear - but a quick look at history shows Nokia, Enron, Amstrad, Sega, and many more which have fallen from great heights until they are mere shells and no longer offer the services which many people once relied on…I like to pose this question to my photography friends - “What would you do if Yahoo! suddenly decided to delete all your Flickr photos?” Some of them have backups - most faint at the thought of all their work vanishing.
Weber’s conclusion:
We discovered there’s been a total of about 251 independent Google products since 199828ya (avoiding add-on features and experiments that merged into other projects), and found that 90, or approximately 36% of them have been canceled. Awesomely, we also collected 8 major flops and 14 major successes, which means that 36% of its high-profile products are failures. That’s quite the coincidence! NOTE: We did not manipulate data to come to this conclusion. It was a happy accident.
In an even more happy accident, my dataset of 350 products yields 123 canceled/shutdown entries, or 35%!↩︎
Some have justified Reader’s shutdown as simply a rational act, since Reader was not bringing in any money and Google is not a charity. The truth seems to be related more to Google’s lack of interest since the start - it’s hard to see how Google could possibly be able to monetize Gmail and not also monetize Reader, which is confirmed by two involved Googlers (from “Google Reader lived on borrowed time: creator Chris Wetherell reflects”):
I wonder, did the company (Google) and the ecosystem at large misread the tea leaves? Did the world at large see an RSS/reader market when in reality the actual market opportunity was in data and sentiment analysis? [Chris] Wetherell agreed. “The reader market never went past the experimental phase and none was iterating on the business model,” he said. “Monetization abilities were never tried.”
“There was so much data we had and so much information about the affinity readers had with certain content that we always felt there was monetization opportunity,” he said. Dick Costolo (currently CEO of Twitter), who worked for Google at the time (having sold Google his company, Feedburner), came up with many monetization ideas but they fell on deaf ears. Costolo, of course is working hard to mine those affinity-and-context connections for Twitter, and is succeeding. What Costolo understood, Google and its mandarins totally missed, as noted in this November 201115ya blog post by Chris who wrote:
Reader exhibits the best unpaid representation I’ve yet seen of a consumer’s relationship to a content producer. You pay for HBO? That’s a strong signal. Consuming free stuff? Reader’s model was a dream. Even better than Netflix. You get affinity (which has clear monetary value) for free, and a tracked pattern of behavior for the act of iterating over differently sourced items - and a mechanism for distributing that quickly to an ostensible audience which didn’t include social guilt or gameification - along with an extensible, scalable platform available via commonly used web technologies - all of which would be an amazing opportunity for the right product visionary. Reader is (was?) for information junkies; not just tech nerds. This market totally exists and is weirdly under-served (and is possibly affluent).
Overall, from just the PR perspective, Google probably would have been better off switching Reader to a subscription model and then eventually killing it while claiming the fees weren’t covering the costs. Offhand, 3 examples of Google adding or increasing fees come to mind: the Maps API, Talk international calls (apparently free initially), and App Engine fees; the API price increase was eventually rescinded as far as I know, and no one remembers the latter two (not even App Engine devs).↩︎
Mark Pilgrim, “Freedom 0”; ironically, Pilgrim (hired by Google in 200719ya) seems to be responsible for at least one of the entries being marked dead, Google’s Doctype tech encyclopedia, since it disappeared around the time of his “infosuicide” and has not been resurrected - it was only partially FLOSS.↩︎
#18 in The Collected Songs of Cold Mountain, Red Pine 200026ya, ISBN 1-55659-140-3↩︎
Xoogler Rachel Kroll on this spike:
↩︎I have some thoughts about the spikes on the death dates.
September: all of the interns go back to school. These people who exist on the fringes of the system manage to get a lot of work done, possibly because they are free of most of the overhead facing real employees. Once they leave, it’s up to the FTEs [Full Time Employee] to own whatever was created, and that doesn’t always work. I wish I could have kept some of them and swapped them for some of the full-timers.
March/April: Annual bonus time? That’s what it used to be, at least, and I say this as someone who quit in May, and that was no accident. Same thing: people leave, and that dooms whatever they left.
0.057; but as the old criticism of NHST goes, “surely God loves the 0.057 almost as much as the 0.050”.↩︎
Specifically: building a logistic model on a bootstrap sample and then testing accuracy against full Google dataset.↩︎
I’ve seen claims that Google Groups is safer than it looks because Google relies on it internally for all its email lists. Certainly, it is probably the Google service whose death has been most prophesied, and least evidenced.↩︎
But note that “sunsetting” of “consumer Google+” was announced in October 2018.↩︎
I include Voice even though I don’t use it or otherwise find it interesting (my criteria for the other 10) because speculation has been rife and because a prediction on its future was requested.↩︎