Link: gwern.net/Embryo%20selection
Embryo selection an add-on to IVF [his summary]:
- harvest x eggs
- fertilize them and create x embryos
- culture the embryos to either cleavage (2-4 days) or blastocyst (5-6 days) stage; of them, y will still be alive & not grossly abnormal
- freeze the embryos
- optional: embryo selection using quality and PGS
- unfreeze & implant 1 embryo; if no embryos left, return to #1 or give up
- if no live birth, go to #6
Gwern asks the question: suppose the technology is ready for this, would the procedure be cost efficient given estimates about the value of cognitive ability? To estimate this is surprisingly difficult due to the lack of easily available information about the cost of IVF, freezing/thawing embryos and so on. Still, one can make some estimates. Gwern finds that currently it is probably not worth it in economic terms (purely in terms of cost benefit of economic gains).
GCTA/GREML results for cognitive ability
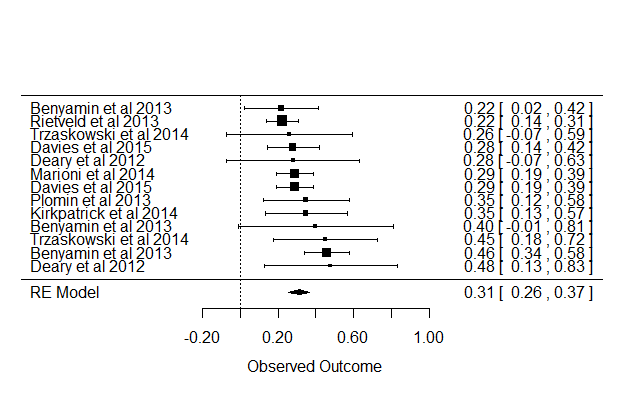
Mixed-Effects Model (k = 13; tau^2 estimator: REML)

tau^2 (estimated amount of residual heterogeneity):     0 (SE = 0.0026)
tau (square root of estimated tau^2 value):             0
I^2 (residual heterogeneity / unaccounted variability): 0.00%
H^2 (unaccounted variability / sampling variability):   1.00
R^2 (amount of heterogeneity accounted for):            100.00%

Test for Residual Heterogeneity:
QE(df = 8) = 3.5513, p-val = 0.8952

Test of Moderators (coefficient(s) 2,3,4,5):
QM(df = 4) = 10.4646, p-val = 0.0333

Model Results:
           estimate       se     zval    pval      ci.lb    ci.ub
intrcpt    -50.2260  53.6941  -0.9354  0.3496  -155.4644  55.0124
SE           0.6149   0.8020   0.7666  0.4433    -0.9571   2.1868
Age.mean    -0.0036   0.0013  -2.8209  0.0048    -0.0061  -0.0011  **
Twin TRUE   -0.1524   0.0893  -1.7060  0.0880    -0.3274   0.0227   .
pub_year     0.0252   0.0267   0.9432  0.3456    -0.0271   0.0774

---
Signif. codes:  0 ‘***’ 0.001 ‘**’ 0.01 ‘*’ 0.05 ‘.’ 0.1 ‘ ’ 1
Of the attempted moderators, age was the most useful. The correlation is in fact -.54 [CI95: -.84 to .02], so maybe. I included the publication year to check for decline effects. Still, when age was in the model, there was not much evidence that standard error had any effect, i.e. no good evidence for publication bias. The funnel plot looks like this:
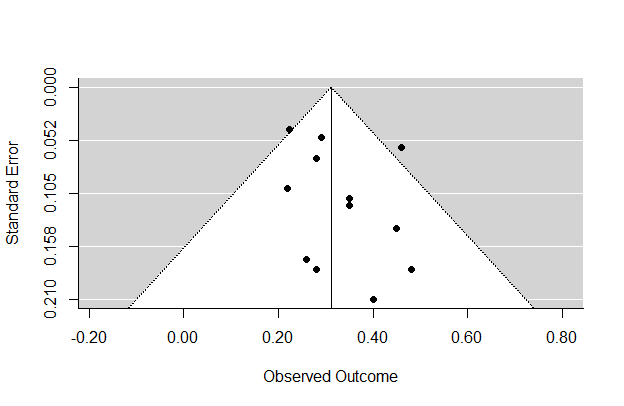
It seems slightly asymmetric, but it could be a fluke. We will have to wait for more studies to see.
Genomic predictive validity in the near future for cognitive ability
Gwern digs up studies that report the R2 (variance explained) values for predicting case-level outcomes. Usually, studies fail in this regard as they only report the R2 value of the hits (that is, SNPs with p<alpha). Instead, they should report the R2 of the polygenic scores using all the SNPs (or some large fraction of them). There is considerable validity of the SNPs whose p<alpha. Note however, that one must be careful with overfitting, so preferably a validation sample should be used (or use standard within cross-validation methods).
Gwern finds that the values in the published studies are quite low, e.g. 2.5% in Rietveld et al (2013). I am more optimistic about the expected R2 values in the near future. This is because the standard GWASes do not use imputed data. However, using that drastically increases the h2n estimates. See the recent paper for height. I expect similar findings to happen for CA as well. As far as I know, there is nothing keeping researchers from using imputed data.
Also note that it is not R2 itself that matters in practice, but the R value (beta). To get half the predictive validity, one need only a forth of the variance explained; sqrt(.25) = .5.
Another problem is that standard GWASes use a poor method of finding hits. Genomic data is sparse (most predictors have betas of 0), so one should use sparse methods, i.e. lasso regression. Steve Hsu has written about it here: arxiv.org/abs/1310.2264 arxiv.org/abs/1408.3421 The reason lasso regression is not used currently is that it requires case-level data to be shared. Researchers don’t currently share case-level data, only summary data. Once again, science is held back by scientists’ (and funders’) unscientific behavior (data hiding).
Future prospects?
In general, tho, I agree with Gwern. Embryo selection for cognitive ability is currently not worth it. However, I expect (90%) that it will be in a few years (<5 years).
R code
The rewritten analysis code for meta-analysis of GCTA/GREML studies.
# libs --------------------------------------------------------------------
library(pacman)
p_load(metafor, stringr, plyr, psych, kirkegaard)


# data --------------------------------------------------------------------
d = read.csv("data/GCTA_CA.csv")


#publication year
d$pub_year = str_extract(d$Study, "\\d+") %>% as.numeric()

#std
d_std = std_df(d, exclude = "HSNP")

# analyses ----------------------------------------------------------------
#sort
d <- d[order(d$Age.mean), ]
d <- d[order(d$HSNP), ]

#basic
rem <- rma(yi=HSNP, sei=SE, data=d); rem

#moderators
print(corr.test(cbind(d$HSNP, d$SE)), short = F)
print(corr.test(cbind(d$HSNP, d$Age.mean)), short = F)

remAge <- rma(yi=HSNP, sei=SE, mods = ~ Age.mean, data=d); remAge
remAgeT <- rma(yi=HSNP, sei=SE, mods = ~ Age.mean + Twin, data=d); remAgeT
remES <- rma(yi=HSNP, sei=SE, mods = ~ SE, data=d); remES
remAll <- rma(yi=HSNP, sei=SE, mods = ~ SE + Age.mean + Twin + pub_year, data=d); remAll

#plots
forest(rma(yi=HSNP, sei=SE, data=d), slab=d$Study)
# GG_forest(rem) + xlim(c(0, 1))
funnel(rma(yi=HSNP, sei=SE, data=d), slab=d$Study)
The datafile:
"Study","HSNP","SE","Age.mean","Twin"
"Deary et al 2012",0.48,0.18,11," FALSE"
"Deary et al 2012",0.28,0.18,71.3," FALSE"
"Plomin et al 2013",0.35,0.117,12," TRUE"
"Benyamin et al 2013",0.22,0.1,12," TRUE"
"Benyamin et al 2013",0.4,0.21,14," TRUE"
"Benyamin et al 2013",0.46,0.06,9," FALSE"
"Rietveld et al 2013",0.224,0.042,57.47," FALSE"
"Marioni et al 2014",0.29,0.05,57," FALSE"
"Kirkpatrick et al 2014",0.35,0.11,14.63," FALSE"
"Trzaskowski et al 2014",0.26,0.17,7," TRUE"
"Trzaskowski et al 2014",0.45,0.14,12," TRUE"
"Davies et al 2015",0.29,0.05,57.2," FALSE"
"Davies et al 2015",0.28,0.07,70," FALSE"