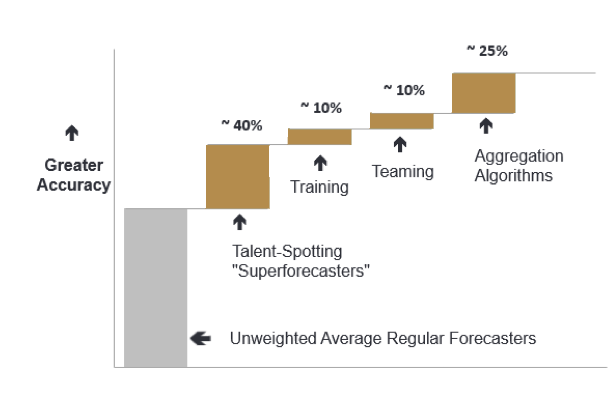
Figure 0: The “four main determinants of forecasting accuracy.” 1
Experience and data from the Good Judgment Project (GJP) provide important evidence about how to make accurate predictions. For a concise summary of the evidence and what we learn from it, see this page. For a review of Superforecasting, the popular book written on the subject, see this blog.
This post explores the evidence in more detail, drawing from the book, the academic literature, the older Expert Political Judgment book, and an interview with a superforecaster. Readers are welcome to skip around to parts that interest them:
1. The experiment
IARPA ran a forecasting tournament from 2011 to 2015, in which five teams plus a control group gave probabilistic answers to hundreds of questions. The questions were generally about potential geopolitical events more than a month but less than a year in the future, e.g. “Will there be a violent incident in the South China Sea in 2013 that kills at least one person?” The questions were carefully chosen so that a reasonable answer would be somewhere between 10% and 90%.2 The forecasts were scored using the original Brier score—more on that in Section 2.3
The winning team was the GJP, run by Philip Tetlock & Barbara Mellers. They recruited thousands of online volunteers to answer IARPA’s questions. These volunteers tended to be males (83%) and US citizens (74%). Their average age was forty. 64% of respondents held a bachelor’s degree, and 57% had postgraduate training.4
GJP made their official predictions by aggregating and extremizing the predictions of their volunteers.5 They identified the top 2% of predictors in their pool of volunteers each year, dubbing them “superforecasters,” and put them on teams in the next year so they could collaborate on special forums. They also experimented with a prediction market, and they did a RCT to test the effect of a one-hour training module on forecasting ability. The module included content about probabilistic reasoning, using the outside view, avoiding biases, and more. Attempts were made to find out which parts of the training were most helpful—see Section 4.
2. The results & their intuitive meaning
Here are some of the key results:
“In year 1 GJP beat the official control group by 60%. In year 2, we beat the control group by 78%. GJP also beat its university-affiliated competitors, including the University of Michigan and MIT, by hefty margins, from 30% to 70%.”6
“The Good Judgment Project outperformed a prediction market inside the intelligence community, which was populated with professional analysts who had classified information, by 25 or 30 percent, which was about the margin by which the superforecasters were outperforming our own prediction market in the external world.”7
“Teams of ordinary forecasters beat the wisdom of the crowd by about 10%. Prediction markets beat ordinary teams by about 20%. And [teams of superforecasters] beat prediction markets by 15% to 30%.”8 “On average, teams were 23% more accurate than individuals.”9
What does Tetlock mean when he says that one group did X% better than another? By examining Table 4 (in Section 4) it seems that he means X% lower Brier score. What is the Brier score? For more details, see the Wikipedia article; basically, it measures the average squared distance from the truth. This is why it’s better to have a lower Brier score—it means you were on average closer to the truth.10
Here is a bar graph of all the forecasters in Year 2, sorted by Brier score:11
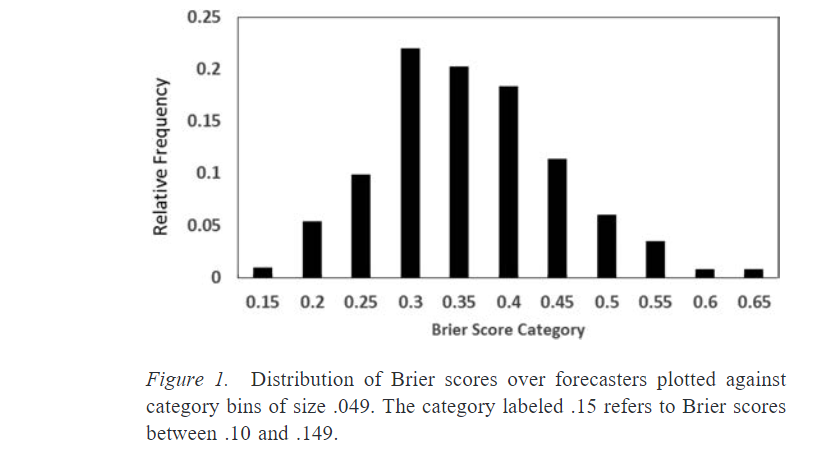
For this set of questions, guessing randomly (assigning even odds to all possibilities) would yield a Brier score of 0.53. So most forecasters did significantly better than that. Some people—the people on the far left of this chart, the superforecasters—did much better than the average. For example, in year 2, the superforecaster Doug Lorch did best with 0.14. This was more than 60% better than the control group.12 Importantly, being a superforecaster in one year correlated strongly with being a superforecaster the next year; there was some regression to the mean but roughly 70% of the superforecasters maintained their status from one year to the next.13
OK, but what does all this mean, in intuitive terms? Here are three ways to get a sense of how good these scores really are:
Way One: Let’s calculate some examples of prediction patterns that would give you Brier scores like those mentioned above. Suppose you make a bunch of predictions with 80% confidence and you are correct 80% of the time. Then your Brier score would be 0.32, roughly middle of the pack in this tournament. If instead it was 93% confidence correct 93% of the time, your Brier score would be 0.132, very close to the best superforecasters and to GJP’s aggregated forecasts.14 In these examples, you are perfectly calibrated, which helps your score—more realistically you would be imperfectly calibrated and thus would need to be right even more often to get those scores.
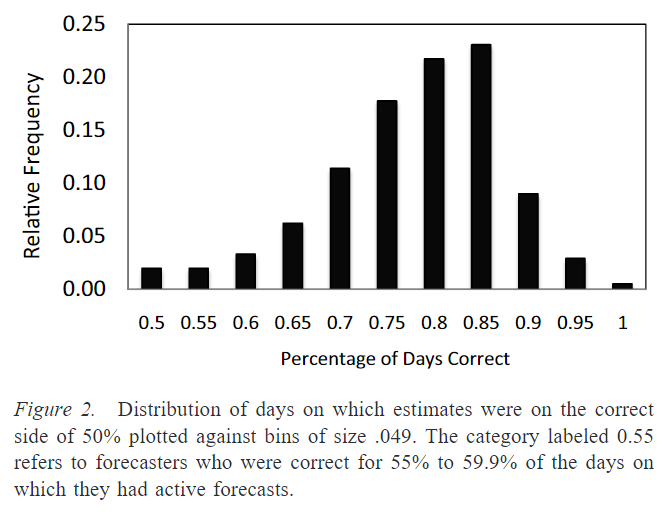
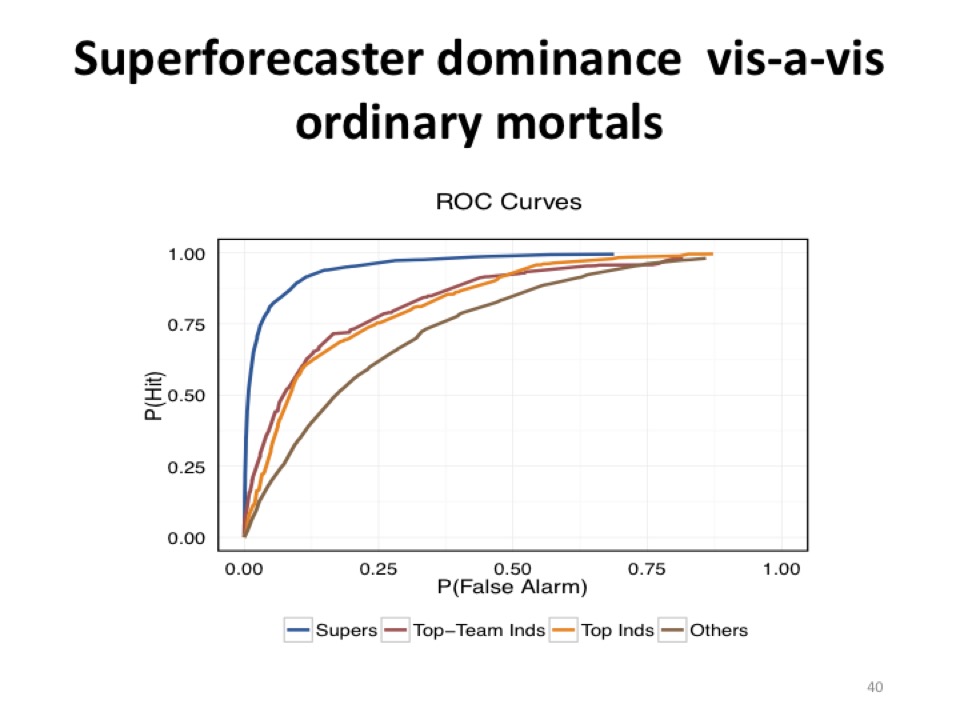
Way Two: “An alternative measure of forecast accuracy is the proportion of days on which forecasters’ estimates were on the correct side of 50%. … For all questions in the sample, a chance score was 47%. The mean proportion of days with correct estimates was 75%…”15 According to this chart, the superforecasters were on the right side of 50% almost all the time:16
Way Three: “Across all four years of the tournament, superforecasters looking out three hundred days were more accurate than regular forecasters looking out one hundred days.”17 (Bear in mind, this wouldn’t necessarily hold for a different genre of questions. For example, information about the weather decays in days, while information about the climate lasts for decades or more.)
3. Correlates of good judgment
The data from this tournament is useful in two ways: It helps us decide whose predictions to trust, and it helps us make better predictions ourselves. This section will focus on which kinds of people and practices best correlate with success—information which is relevant to both goals. Section 4 will cover the training experiment, which helps to address causation vs. correlation worries.
Feast your eyes on this:18
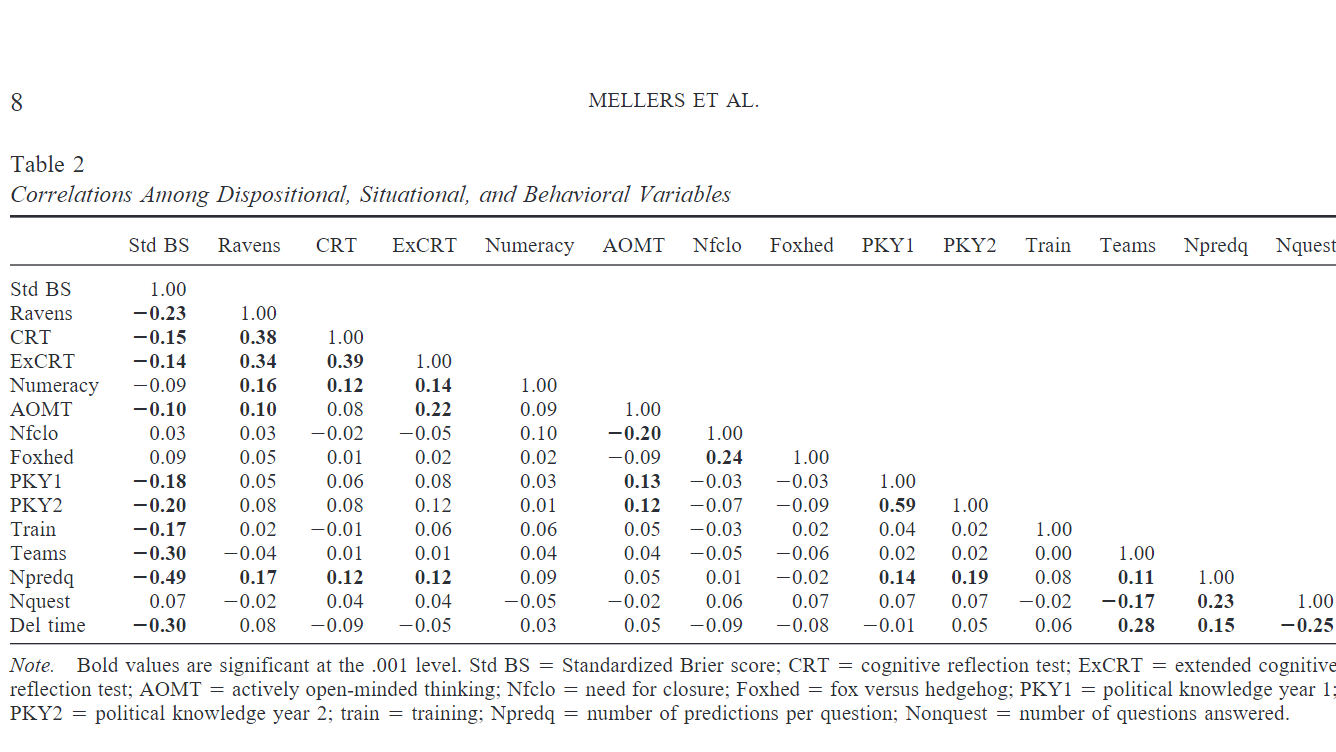
This shows the correlations between various things.19 The leftmost column is the most important; it shows how each variable correlates with (standardized) Brier score. (Recall that Brier scores measure inaccuracy, so negative correlations are good.)
It’s worth mentioning that while intelligence correlated with accuracy, it didn’t steal the show.20 The same goes for time spent deliberating.21 The authors summarize the results as follows: “The best forecasters scored higher on both intelligence and political knowledge than the already well-above-average group of forecasters. The best forecasters had more open-minded cognitive styles. They benefited from better working environments with probability training and collaborative teams. And while making predictions, they spent more time deliberating and updating their forecasts.”22
That big chart depicts all the correlations individually. Can we use them to construct a model to take in all of these variables and spit out a prediction for what your Brier score will be? Yes we can:
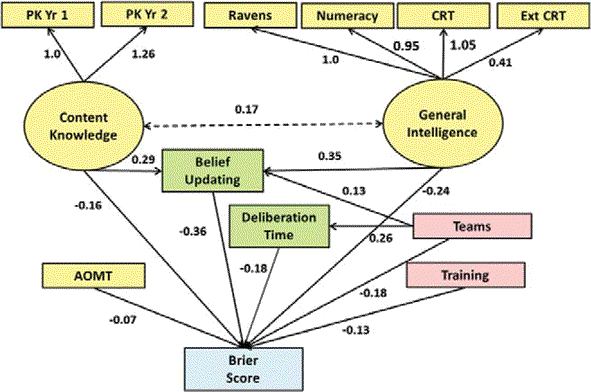
This model has a multiple correlation of 0.64.23 Earlier, we noted that superforecasters typically remained superforecasters (i.e. in the top 2%), proving that their success wasn’t mostly due to luck. Across all the forecasters, the correlation between performance in one year and performance in the next year is 0.65.24 So we have two good ways to predict how accurate someone will be: Look at their past performance, and look at how well they score on the structural model above.
I speculate that these correlations underestimate the true predictability of accuracy, because the forecasters were all unpaid online volunteers, and many of them presumably had random things come up in their life that got in the way of making good predictions—perhaps they have a kid, or get sick, or move to a new job and so stop reading the news for a month, and their accuracy declines.25 Yet still 70% of the superforecasters in one year remained superforecasters in the next.
Finally, what about superforecasters in particular? Is there anything to say about what it takes to be in the top 2%?
Tetlock devotes much of his book to this. It is hard to tell how much his recommendations come from data analysis and how much are just his own synthesis of the interviews he’s conducted with superforecasters. Here is his “Portrait of the modal superforecaster.”26
Philosophic outlook:
- Cautious: Nothing is certain.
- Humble: Reality is infinitely complex.
- Nondeterministic: Whatever happens is not meant to be and does not have to happen.
Abilities & thinking styles:
- Actively open-minded: Beliefs are hypotheses to be tested, not treasures to be protected.
- Intelligent and knowledgeable, with a “Need for Cognition”: Intellectually curious, enjoy puzzles and mental challenges.
- Reflective: Introspective and self-critical.
- Numerate: Comfortable with numbers.
Methods of forecasting:
- Pragmatic: Not wedded to any idea or agenda.
- Analytical: Capable of stepping back from the tip-of-your-nose perspective and considering other views.
- Dragonfly-eyed: Value diverse views and synthesize them into their own.
- Probabilistic: Judge using many grades of maybe.
- Thoughtful updaters: When facts change, they change their minds.
- Good intuitive psychologists: Aware of the value of checking thinking for cognitive and emotional biases.
Work ethic:
- Growth mindset: Believe it’s possible to get better.
- Grit: Determined to keep at it however long it takes.
Additionally, there is experimental evidence that superforecasters are less prone to standard cognitive science biases than ordinary people.27 This is particularly exciting because—we can hope—the same sorts of training that help people become superforecasters might also help overcome biases.
Finally, Tetlock says that “The strongest predictor of rising into the ranks of superforecasters is perpetual beta, the degree to which one is committed to belief updating and self-improvement. It is roughly three times as powerful a predictor as its closest rival, intelligence.”28 Unfortunately, I couldn’t find any sources or data on this, nor an operational definition of “perpetual beta,” so we don’t know how he measured it.29
4. The training and Tetlock’s commandments
This section discusses the surprising effect of the training module on accuracy, and finishes with Tetlock’s training-module-based recommendations for how to become a better forecaster.30
The training module, which was randomly given to some participants but not others, took about an hour to read.31 The authors describe the content as follows:
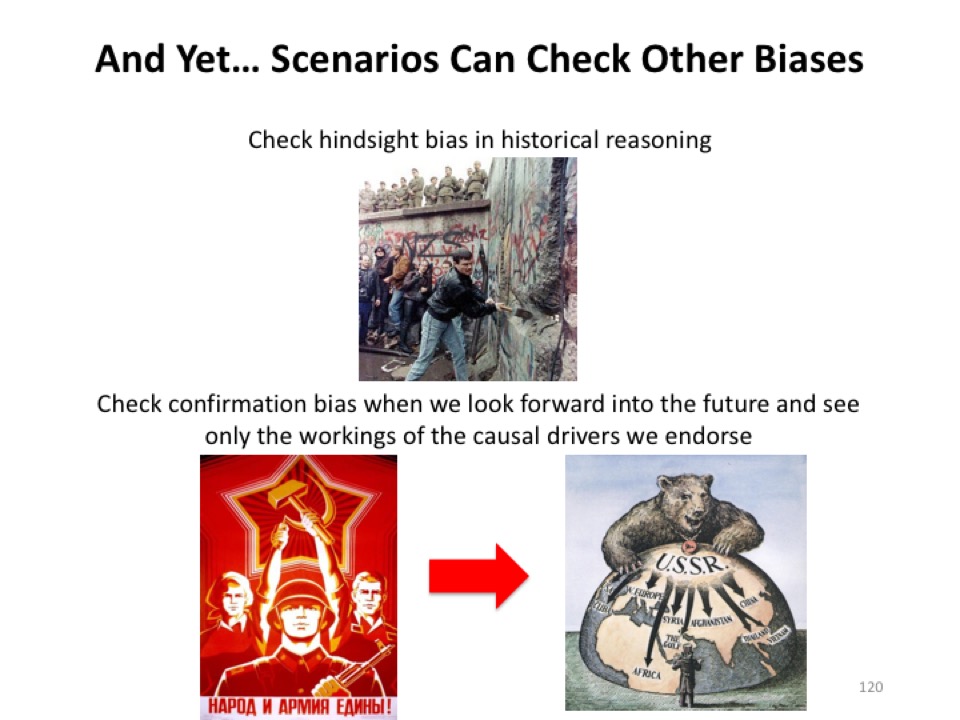
“Training in year 1 consisted of two different modules: probabilistic reasoning training and scenario training. Scenario-training was a four-step process: 1) developing coherent and logical probabilities under the probability sum rule; 2) exploring and challenging assumptions; 3) identifying the key causal drivers; 4) considering the best and worst case scenarios and developing a sensible 95% confidence interval of possible outcomes; and 5) avoid over-correction biases. … Probabilistic reasoning training consisted of lessons that detailed the difference between calibration and resolution, using comparison classes and base rates (Kahneman & Tversky, 1973; Tversky & Kahneman, 1981), averaging and using crowd wisdom principles (Surowiecki, 2005), finding and utilizing predictive mathematical and statistical models (Arkes, 1981; Kahneman & Tversky, 1982), cautiously using time-series and historical data, and being self-aware of the typical cognitive biases common throughout the population.”32
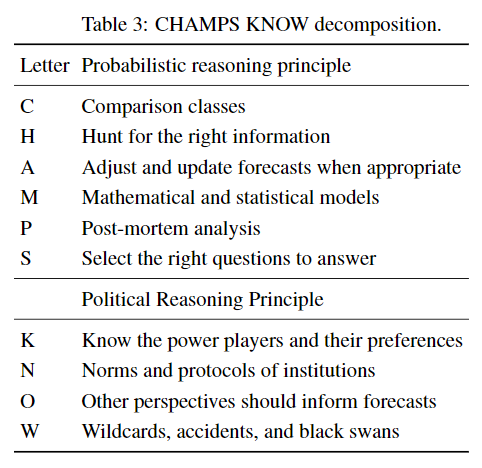
In later years, they merged the two modules into one and updated it based on their observations of the best forecasters. The updated training module is organized around an acronym:33
Impressively, this training had a lasting positive effect on accuracy in all four years:
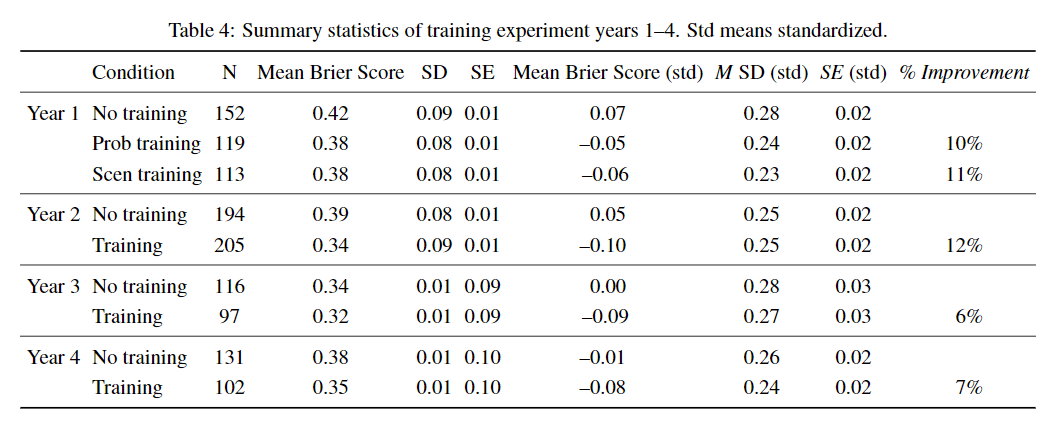
One might worry that training improves accuracy by motivating the trainees to take their jobs more seriously. Indeed it seems that the trained forecasters made more predictions per question than the control group, though they didn’t make more predictions overall. Nevertheless it seems that the training also had a direct effect on accuracy as well as this indirect effect.34
Moving on, let’s talk about the advice Tetlock gives to his audience in Superforecasting, advice which is based on, though not identical to, the CHAMPS-KNOW training. The book has a few paragraphs of explanation for each commandment, a transcript of which is here; in this post I’ll give my own abbreviated explanations:
TEN COMMANDMENTS FOR ASPIRING SUPERFORECASTERS
(1) Triage: Don’t waste time on questions that are “clocklike” where a rule of thumb can get you pretty close to the correct answer, or “cloudlike” where even fancy models can’t beat a dart-throwing chimp.
(2) Break seemingly intractable problems into tractable sub-problems: This is how Fermi estimation works. One related piece of advice is “be wary of accidentally substituting an easy question for a hard one,” e.g. substituting “Would Israel be willing to assassinate Yasser Arafat?” for “Will at least one of the tests for polonium in Arafat’s body turn up positive?”
(3) Strike the right balance between inside and outside views: In particular, first anchor with the outside view and then adjust using the inside view. (More on this in Section 5)
(4) Strike the right balance between under- and overreacting to evidence: “Superforecasters aren’t perfect Bayesian predictors but they are much better than most of us.”35 Usually do many small updates, but occasionally do big updates when the situation calls for it. Take care not to fall for things that seem like good evidence but aren’t; remember to think about P(E|H)/P(E|~H); remember to avoid the base-rate fallacy.
(5) Look for the clashing causal forces at work in each problem: This is the “dragonfly eye perspective,” which is where you attempt to do a sort of mental wisdom of the crowds: Have tons of different causal models and aggregate their judgments. Use “Devil’s advocate” reasoning. If you think that P, try hard to convince yourself that not-P. You should find yourself saying “On the one hand… on the other hand… on the third hand…” a lot.
(6) Strive to distinguish as many degrees of doubt as the problem permits but no more: Some people criticize the use of exact probabilities (67%! 21%!) as merely a way to pretend you know more than you do. There might be another post on the subject of why credences are better than hedge words like “maybe” and “probably” and “significant chance;” for now, I’ll simply mention that when the authors rounded the superforecaster’s forecasts to the nearest 0.05, their accuracy dropped.36 Superforecasters really were making use of all 101 numbers from 0.00 to 1.00!
(7) Strike the right balance between under- and overconfidence, between prudence and decisiveness.
(8) Look for the errors behind your mistakes but beware of rearview-mirror hindsight biases.
(9) Bring out the best in others and let others bring out the best in you: The book spent a whole chapter on this, using the Wehrmacht as an extended case study on good team organization.37 One pervasive guiding principle is “Don’t tell people how to do things; tell them what you want accomplished, and they’ll surprise you with their ingenuity in doing it.” The other pervasive guiding principle is “Cultivate a culture in which people—even subordinates—are encouraged to dissent and give counterarguments.”38
(10) Master the error-balancing bicycle: This one should have been called practice, practice, practice. Tetlock says that reading the news and generating probabilities isn’t enough; you need to actually score your predictions so that you know how wrong you were.
(11) Don’t treat commandments as commandments: Tetlock’s point here is simply that you should use your judgment about whether to follow a commandment or not; sometimes they should be overridden.
It’s worth mentioning at this point that the advice is given at the end of the book, as a sort of summary, and may make less sense to someone who hasn’t read the book. In particular, Chapter 5 gives a less formal but more helpful recipe for making predictions, with accompanying examples. See the end of this blog post for a summary of this recipe.
5. On the Outside View & Lessons for AI Impacts
The previous section summarized Tetlock’s advice for how to make better forecasts; my own summary of the lessons I think we should learn is more concise and comprehensive and can be found at this page. This section goes into detail about one particular, more controversial matter: The importance of the “outside view,” also known as reference class forecasting. This research provides us with strong evidence in favor of this method of making predictions; however, the situation is complicated by Tetlock’s insistence that other methods are useful as well. This section discusses the evidence and attempts to interpret it.
The GJP asked people who took the training to self-report which of the CHAMPS-KNOW principles they were using when they explained why they made a forecast; 69% of forecast explanations received tags this way. The only principle significantly positively correlated with successful forecasts was C: Comparison classes.39 The authors take this as evidence that the outside view is particularly important. Anecdotally, the superforecaster I interviewed agreed that reference class forecasting was perhaps the most important piece of the training. (He also credited the training in general with helping him reach the ranks of the superforecasters.)
Moreover, Tetlock did an earlier, much smaller forecasting tournament from 1987-2003, in which experts of various kinds made the forecasts.40 The results were astounding: Many of the experts did worse than random chance, and all of them did worse than simple algorithms:
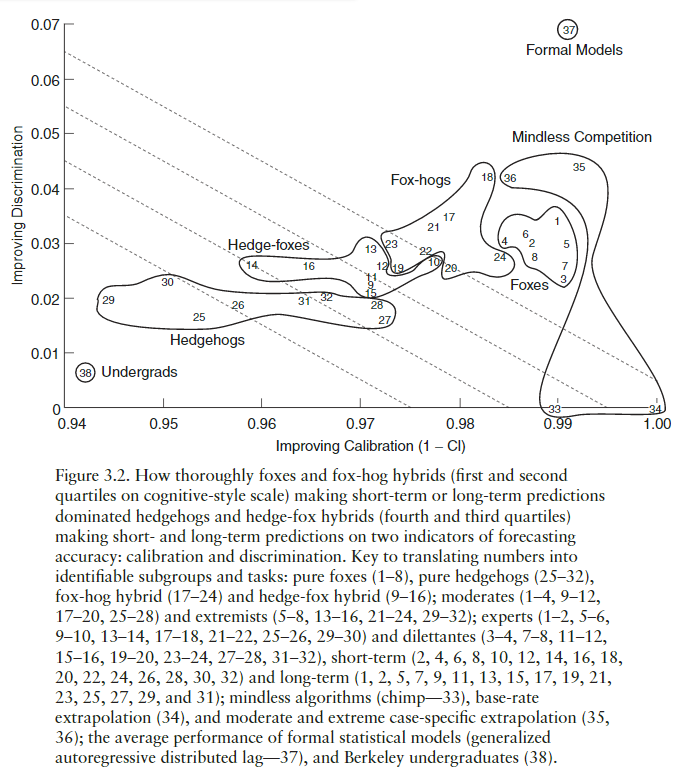
Figure 3.2, pulled from Expert Political Judgment, is a gorgeous depiction of some of the main results.41 Tetlock used something very much like a Brier score in this tournament, but he broke it into two components: “Discrimination” and “Calibration.” This graph plots the various experts and algorithms on the axes of discrimination and calibration. Notice in the top right corner the “Formal models” box. I don’t know much about the model used but apparently it was significantly better than all of the humans. This, combined with the fact that simple case-specific trend extrapolations also beat all the humans, is strong evidence for the importance of the outside view.
So we should always use the outside view, right? Well, it’s a bit more complicated than that. Tetlock’s advice is to start with the outside view, and then adjust using the inside view.42 He even goes so far as to say that hedgehoggery and storytelling can be valuable when used properly.
First, what is hedgehoggery? Recall how the human experts fall on a rough spectrum in Figure 3.2, with “hedgehogs” getting the lowest scores and “foxes” getting the highest scores. What makes someone a hedgehog or a fox? Their answers to these questions.43 Tetlock characterizes the distinction as follows:
Low scorers look like hedgehogs: thinkers who “know one big thing,” aggressively extend the explanatory reach of that one big thing into new domains, display bristly impatience with those who “do not get it,” and express considerable confidence that they are already pretty proficient forecasters, at least in the long term. High scorers look like foxes: thinkers who know many small things (tricks of their trade), are skeptical of grand schemes, see explanation and prediction not as deductive exercises but rather as exercises in flexible “ad hocery” that require stitching together diverse sources of information, and are rather diffident about their own forecasting prowess, and … rather dubious that the cloudlike subject of politics can be the object of a clocklike science.44
Next, what is storytelling? Using your domain knowledge, you think through a detailed scenario of how the future might go, and you tweak it to make it more plausible, and then you assign a credence based on how plausible it seems. By itself this method is unpromising.45
Despite this, Tetlock thinks that storytelling and hedgehoggery are valuable if handled correctly. On hedgehogs, Tetlock says that hedgehogs provide a valuable service by doing the deep thinking necessary to build detailed causal models and raise interesting questions; these models and questions can then be slurped up by foxy superforecasters, evaluated, and aggregated to make good predictions.46 The superforecaster Bill Flack is quoted in agreement.47 As for storytelling, see these slides from Tetlock’s edge.org seminar:
As the second slide indicates, the idea is that we can sometimes “fight fire with fire” by using some stories to counter other stories. In particular, Tetlock says there has been success using stories about the past—about ways that the world could have gone, but didn’t—to “reconnect us to our past states of ignorance.”48 The superforecaster I interviewed said that it is common practice now on superforecaster forums to have a designated “red team” with the explicit mission of finding counter-arguments to whatever the consensus seems to be. This, I take it, is an example of motivated reasoning being put to good use.
Moreover, arguably the outside view simply isn’t useful for some questions.49 People say this about lots of things—e.g. “The world is changing so fast, so the current situation in Syria is unprecedented and historical averages will be useless!”—and are proven wrong; for example, this research seems to indicate that the outside view is far more useful in geopolitics than people think. Nevertheless, maybe it is true for some of the things we wish to predict about advanced AI. After all, a major limitation of this data is that the questions were mainly on geopolitical events only a few years in the future at most. (Geopolitical events seem to be somewhat predictable up to two years out but much more difficult to predict five, ten, twenty years out.)50 So this research does not directly tell us anything about the predictability of the events AI Impacts is interested in, nor about the usefulness of reference-class forecasting for those domains.51
That said, the forecasting best practices discovered by this research seem like general truth-finding skills rather than cheap hacks only useful in geopolitics or only useful for near-term predictions. After all, geopolitical questions are themselves a fairly diverse bunch, yet accuracy on some was highly correlated with accuracy on others.52 So despite these limitations I think we should do our best to imitate these best-practices, and that means using the outside view far more than we would naturally be inclined.
One final thing worth saying is that, remember, the GJP’s aggregated judgments did at least as well as the best superforecasters.53 Presumably at least one of the forecasters in the tournament was using the outside view a lot; after all, half of them were trained in reference-class forecasting. So I think we can conclude that straightforwardly using the outside view as often as possible wouldn’t get you better scores than the GJP, though it might get you close for all we know. Anecdotally, it seems that when the superforecasters use the outside view they often aggregate between different reference-class forecasts.54 The wisdom of the crowds is powerful; this is consistent with the wider literature on the cognitive superiority of groups, and the literature on ensemble methods in AI.55
Tetlock describes how superforecasters go about making their predictions.56 Here is an attempt at a summary:
- Sometimes a question can be answered more rigorously if it is first “Fermi-ized,” i.e. broken down into sub-questions for which more rigorous methods can be applied.
- Next, use the outside view on the sub-questions (and/or the main question, if possible). You may then adjust your estimates using other considerations (‘the inside view’), but do this cautiously.
- Seek out other perspectives, both on the sub-questions and on how to Fermi-ize the main question. You can also generate other perspectives yourself.
- Repeat steps 1 – 3 until you hit diminishing returns.
- Your final prediction should be based on an aggregation of various models, reference classes, other experts, etc.
Footnotes
- This graph can be found here, the GJP’s list of academic literature on this topic. The graph illustrates approximate relative effects. It will be discussed more in Section 2.
- This is from my conversation with the superforecaster.
- They did this so that they could include occasional non-binary questions. They show here that their results are robust to using a logarithmic scoring rule instead.
- These statistics come from this study. The dataset excludes individuals who signed up but failed to register at least 25 predictions in a given year.
- The aggregation algorithm was elitist, meaning that it weighted more heavily forecasters with good track-records who had updated their forecasts more often. This description of elitism comes from the webpage. In these slides Tetlock describes the elitism differently: He says it gives weight to higher-IQ, more open-minded forecasters. The extremizing step pushes the aggregated judgment closer to 1 or 0, to make it more confident. The degree to which they extremize depends on how diverse and sophisticated the pool of forecasters is. The academic papers on this topic can be found here and here. Whether extremizing is a good idea is controversial; according to one expert I interviewed, more recent data suggests that the successes of the extremizing algorithm during the forecasting tournament were a fluke. After all, a priori one would expect extremizing to lead to small improvements in accuracy most of the time, but big losses in accuracy some of the time.
- Superforecasting p18. On page 69: “Teams had to beat the combined forecast—the “wisdom of the crowd”—of the contro group, and by margins we all saw as intimidating. In the first year, IARPA wanted teams to beat that standard by 20%—and it wanted that margin of victory to grow to 50% by the fourth year.” In light of this, it is especially impressive that individual superforecasters in the first two years beat the wisdom-of-the-crowds-of-the-control-group by ~60% and that the GJP beat it by 78%. (p72)
- Transcript of this seminar.
- Superforecasting p207
- Superforecasting p201
- The best possible Brier score is 0; the Brier score achieved by guessing randomly depends on which version of the score you use and how many possible outcomes each prediction chooses between. For binary predictions, which constituted the bulk of IARPA’s questions, the original version of the Brier score is effectively twice the squared distance from the truth, so always guessing 50% would yield a score of 0.5.
- This is from this study. The data covers the first two years of the tournament.
- Superforecasting p93
- Superforecasting p104
- To calculate this, I assumed binary questions and plugged the probability, p, into this formula: P(event_doesn’t_happen)(0-p)^2+P(event_happens)(1-p)^2 = (1-p)(0-p)^2+(p)(1-p)^2. I then doubled it, since we are using the original Brier score that ranges between 0-2 instead of 0-1. I can’t find stats on GJP’s Brier score, but recall that in year 2 it was 78% better than the control group, and Doug Lorch’s 0.14 was 60% better than the control group. (Superforecasting p93)
- This is from the same study, as are the two figures.
- The correlation between average Brier score and how often you were on the right side of 50% was 0.89 (same study), so I think it’s safe to assume the superforecasters were somewhere on the right side of the peak in Figure 2. (I assume they mean being on the right side of 50% correlates with lower Brier scores; the alternative is crazy.) The high proportion of guesses on the right side of 50% is a puzzling fact—doesn’t it suggest that they were poorly calibrated, and that they could improve their scores by extremizing their judgments? I think what’s going on here is that the majority of forecasts made on most questions by superforecasters were highly (>90%) confident, and also almost always correct.
- Superforecasting p94, emphasis mine. Later, in the edge.org seminar, Tetlock says “In some other ROC curves—receiver operator characteristic curves, from signal detection theory—that Mark Steyvers at UCSD constructed—superforecasters could assign probabilities 400 days out about as well as regular people could about eighty days out.” The quote is accompanied by a graph; unfortunately, it’s hard to interpret.
- This table is from the same study.
- “Ravens” is an IQ test, “Numeracy” is a mathematical aptitude test.
- That said, as Carl Shulman pointed out, the forecasters in this sample were probably above-average IQ, so the correlation between IQ and accuracy in this sample is almost certainly smaller than the “true” correlation in the population at large. See e.g. restriction of range and the Thorndike Correction.
- “Deliberation time, which was only measured in Year 2, was transformed by a logarithmic function (to reduce tail effects) and averaged over questions. The average length of deliberation time was 3.60 min, and the average number of questions tried throughout the 2-year period was 121 out of 199 (61% of all questions). Correlations between standardized Brier score accuracy and effort were statistically significant for belief updating, … and deliberation time, … but not for number of forecasting questions attempted.” (study) Anecdotally, I spoke to a superforecaster who said that the best of the best typically put a lot of time into it; he spends maybe fifteen minutes each day making predictions but several hours per day reading news, listening to relevant podcasts, etc.
- This is from the same study
- “Nonetheless, as we saw in the structural model, and confirm here, the best model uses dispositional, situational, and behavioral variables. The combination produced a multiple correlation of .64.” (study) Yellow ovals are latent dispositional variables, yellow rectangles are observed dispositional variables, pink rectangles are experimentally manipulated situational variables, and green rectangles are observed behavioral variables. If this diagram follows convention, single-headed arrows represent hypothesized causation, whereas the double-headed arrow represents a correlation without any claim being made about causation.
- Superforecasting p104
- Of course, these things can happen in the real world too—maybe our AI timelines forecasters will get sick and stop making good forecasts. What I’m suggesting is that this data is inherently noisier than data from a group of full-time staff whose job it is to predict things would be. Moreover, when these things happen in the real world, we can see that they are happening and adjust our model accordingly, e.g. “Bob’s really busy with kids this month, so let’s not lean as heavily on his forecasts as we usually do.”
- Superforecasting p191
- From edge.org: Mellers: “We have given them lots of Kahneman and Tversky-like problems to see if they fall prey to the same sorts of biases and errors. The answer is sort of, some of them do, but not as many. It’s not nearly as frequent as you see with the rest of us ordinary mortals. The other thing that’s interesting is they don’t make the kinds of mistakes that regular people make instead of the right answer. They do something that’s a little bit more thoughtful. They integrate base rates with case-specific information a little bit more.”
Tetlock: “They’re closer to Bayesians.”
Mellers: “Right. They’re a little less sensitive to framing effects. The reference point doesn’t have quite the enormous role that it does with most people.” - Superforecasting p192
- Moreover, a quick search through Google Scholar and library.unc.edu turned up nothing of interest. I reached out to Tetlock to ask questions but he hasn’t responded yet.
- “The guidelines sketched here distill key themes in this book and in training systems that have been experimentally demonstrated to boost accuracy in real-world forecasting tournaments.” (277)
- This is from this study. Relevant quote: “Although the training lasted less than one hour, it consistently improved accuracy (Brier scores) by 6 to 11% over the control condition.”
- Same study.
- Same study.
- See sections 3.3, 3.5, and 3.6 of this study.
- Superforecasting p281
- This is from Friedman et al (2018), available here.
- Scott Alexander: “Later in the chapter, he admits that his choice of examples might raise some eyebrows, but says that he did it on purpose to teach us to think critically and overcome cognitive dissonance between our moral preconceptions and our factual beliefs. I hope he has tenure.”
- See e.g. page 284 of Superforecasting, and the entirety of chapter 9.
- This is from this paper. One worry I have about it is that another principle, P, was strongly associated with inaccuracy, but the authors explain this away by saying that “Post-mortem analyses,” the P’s, are naturally done usually after bad forecasts. This makes me wonder if a similar explanation could be given for the success of the C’s: Questions for which a good reference class exists are easier than others.
- The results and conclusions from this tournament can be found in the resulting book, Expert Political Judgment: How good is it? How can we know? See p242 for a description of the methodology and dates.
- Page 77.
- Superforecasting p120
- For the data on how these questions were weighted in determining foxyness, see Expert Political Judgment p74
- Expert Political Judgment p75
- There are several reasons to worry about this method. For one, it’s not what foxes do, and foxes score better than hedgehogs. Tetlock also says it’s not what superforecasters do. More insightfully, Tetlock says we are biased to assign more probability to more vivid and interesting stories, and as a result it’s easy for your probabilities to sum to much more than 1. Anecdote: I was answering a series of “Probability of extinction due to cause X” questions on Metaculus, and I soon realized that my numbers were going to add up to more than 100%, so I had to adjust them all down systematically to make room for the last few kinds of disaster on the list. If I hadn’t been assigning explicit probabilities, I wouldn’t have noticed the error. And if I hadn’t gone through the whole list of possibilities, I would have come away with an unjustifiably high credence in the few I had considered.
- Superforecasting p266. This is reminiscent of Yudkowsky’s perspective on what is essentially this same debate.
- Superforecasting p271.
- Same seminar.
- For example, see Yudkowsky: “Where two sides disagree, this can lead to reference class tennis—both parties get stuck insisting that their own “outside view” is the correct one, based on diverging intuitions about what similarities are relevant. If it isn’t clear what the set of “similar historical cases” is, or what conclusions we should draw from those cases, then we’re forced to use an inside view—thinking about the causal process to distinguish relevant similarities from irrelevant ones. You shouldn’t avoid outside-view-style reasoning in cases where it looks likely to work, like when planning your Christmas shopping. But in many contexts, the outside view simply can’t compete with a good theory.”
- Tetlock admits that “there is no evidence that geopolitical or economic forecasters can predict anything ten years out beyond the excruciatingly obvious… These limits on predictability are the predictable results of the butterfly dynamics of nonlinear systems. In my EPJ research, the accuracy of expert predictions declined toward chance five years out.” (Superforecasting p243) I highly recommend the graphic on that page, by the way, also available here: “Thoughts for the 2001 Quadrennial Defense Review.”
- The superforecaster I interviewed speculated that predicting things like the continued drop in price of computing hardware or solar panels is fairly easy, but that predicting the appearance of new technologies is very difficult. Tetlock has ideas for how to handle longer-term, nebulous questions. He calls it “Bayesian Question Clustering.” (Superforecasting 263) The idea is to take the question you really want to answer and look for more precise questions that are evidentially relevant to the question you care about. Tetlock intends to test the effectiveness of this idea in future research.
- “There are several ways to look for individual consistency across questions. We sorted questions on the basis of response format (binary, multinomial, conditional, ordered), region (Eurzone, Latin America, China, etc.), and duration of question (short, medium, and long). We computed accuracy scores for each individual on each variable within each set (e.g., binary, multinomial, conditional, and ordered) and then constructed correlation matrices. For all three question types, correlations were positive… Then we conducted factor analyses. For each question type, a large proportion of the variance was captured by a single factor, consistent with the hypothesis that one underlying dimension was necessary to capture correlations among response formats, regions, and question duration.” (from this study)
- I haven’t found this said explicitly, but I infer this from Doug Lorch, the best superforecaster in Year 2, beating the control group by at least 60% when the GJP beat the control group by 78%. (Superforecasting 93, 18) That said, page 72 seems to say that in Year 2 exactly one person—Doug Lorch—managed to beat the aggregation algorithm. This is almost a contradiction; I’m not sure what to make of it. At any rate, it seems that the aggregation algorithm pretty reliably does better than the superforecasters in general, even if occasionally one of them beats it.
- This is on page 304. Another example on 313.
- For more on these, see this page.
- This is my summary of Tetlock’s advice in Chapter 5: “Ultimately, it’s not the number crunching power that counts. It’s how you use it. … You’ve Fermi-ized the question, consulted the outside view, and now, finally, you can consult the inside view … So you have an outside view and an inside view. Now they have to be merged. …”


2 Trackbacks / Pingbacks
Comments are closed.