Notes relating to my use of a treadmill desk and 2 self-experiments showing walking treadmill use interferes with typing and memory performance.
Sleep
In June 2012, early in the experiment, my neighbors threw out a treadmill that turned out to be easily repaired and so I set up an improvised treadmill desk with my laptop and a spare board. I had read about them before, had since seen a number of negative reports about being sedentary or sitting, and my physical fitness had declined markedly since leaving university (with ready access to the gym, fencing club, and Taekwondo class), so it seemed like a good thing to do. The lowest setting on the treadmill (no incline, 1MPH) was initially fairly exhausting but I improved. I started with one mile a day and moved up in a few days to 3-4 miles a day (putting me at the high end of my daily steps as recorded by my pedometer, which annoyingly I lost just 2 days before finding the treadmill); for some reason, this seemed to affect my weight, which went from 218 pounds to 214 a week later and 213 the next day. I finetuned the treadmill desk for typing on my laptop by increasing the height of the board with book supports. My productivity suffered drastically the first days, and I was concerned it would render typing difficult, but my scores in my typing practice program (Amphetype) did not seem to change very much when I tested them on all subsequent days that I used the treadmill. I suspect that my average WPM went down somewhat, though my statistical analysis indicated it fell slightly (see the typing section). The gear on the treadmill itself began to loosen, which led to the rubber band slipping off the motor or the gear, and I had to stop for a few days while I figured out solutions. (The epoxy was a mistake as it required a ‘hardener’ I didn’t have; a thin nail couldn’t be hammered between the gear and treadmill bar as a shim; and I had to let the Gorilla Glue harden for a day before it performed admirably during the test run.) A few days later, the mat began slipping and just stopping, and I discovered that the gear was rotating freely on the treadmill bar - the friction and glue had apparently lost! I lost several days hoping it would dry. It did and seemed to work again, but to help deal with it, I lubricated the underside of the mat with WD-40. It seemed to work
My expectations are that the treadmill will increase how much I sleep, decrease sleep latency, and possibly have a small negative effect on productivity (which may be offset by an improvement in mood and less need to get a daily walk). Subjectively, whenever I use the treadmill, it feels like I can’t work on hard material like programming or statistics, and I need to sit down and be still to really focus; I wonder if it is because my head bobbles slightly as I walk, and if a VR solution like an Oculus Rift might fix the jiggling issue, inasmuch as they are mounted on one’s head and use precision head-tracking technologies and future VR headsets are expected to include eye tracking for foveated rendering. (If the walking were intense aerobic fitness, I might expect an increase in cognitive abilities or various sorts, but it’s not, so I don’t expect any effect on Mnemosyne scores.) Another possible solution would be treadles underneath the desk, as if it was a foot-powered sewing machine, which are available under the names of ‘desk cycles’ or ‘under desk bicycles’ or ‘under-desk ellipticals’; I haven’t been able to give them a try yet.
Typing
Fortunately, I had used Amphetype for typing practice for 3 years prior to finding the treadmill, so I could compare my daily treadmill typing sessions to a very long dataseries.
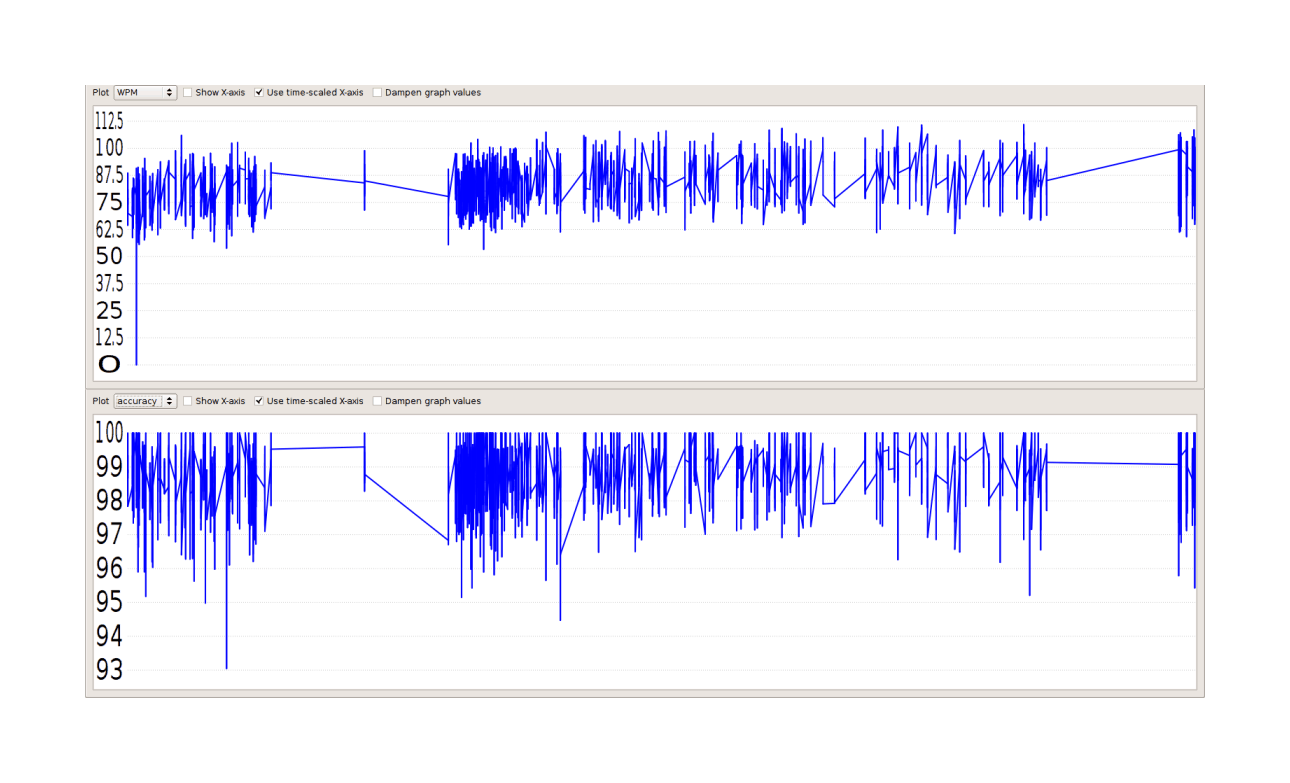
The graph looks like WPM (but not Accuracy) may have been damaged, but it’s not clear at all: we should do statistics. Amphetype stores the graphed data in a SQLite database, which after a little tinkering I figured out how to extract the WPM & Accuracy scores:
$ sqlite3 -batch gwern.db 'SELECT w real, wpm real, accuracy real FROM result;' > ~/stats.txtWhich gives a file like
1233502576.01172|70.2471151325281|0.981412639405205
1233502634.48339|80.9762013034008|0.989159891598916
1233502677.26434|74.0623733171948|0.988326848249027
...
The pipes are delimiters, which I replaced with commas (tr '|' ','). The first field is a date-stamp expressed in seconds since the Unix epoch; they can be converted to more readable dates like so:
$ date --date '@1308320681.44771'
Fri Jun 17 10:24:41 EDT 2011
I went through the 2870 lines until I found the first treadmill session I did on June 16. After splitting, deleting the date-stamps, and adding a CSV header like WPM,Accuracy, I had had 2285 entries for 2012-gwern-amphetype-before.csv and 585 for 2012-gwern-amphetype-after.csv. Then it is easy to load the CSVs into R and test:
before <- read.csv("https://gwern.net/doc/personal/2012-gwern-amphetype-before.csv")
before$Treadmill <- 0
after <- read.csv("https://gwern.net/doc/personal/2012-gwern-amphetype-after.csv")
after$Treadmill <- 1
amphetype <- rbind(before,after)
l <- lm(cbind(WPM, Accuracy) ~ Treadmill, data=amphetype)

summary(manova(l))
#             Df Pillai approx F num Df den Df Pr(>F)
# Treadmill    1 0.0556     84.4      2   2867 <2e-16
#
# summary(l)
# Response WPM :
#
# Coefficients:
#             Estimate Std. Error t value Pr(>|t|)
# (Intercept)   82.343      0.195   422.2   <2e-16
# Treadmill      5.216      0.432    12.1   <2e-16
#
# Response Accuracy :
#
# Coefficients:
#             Estimate Std. Error t value Pr(>|t|)
# (Intercept) 0.987517   0.000170 5813.22  < 2e-16
# Treadmill   0.001610   0.000376    4.28  1.9e-05
What? Using a treadmill made my average WPM go up 5 WPM? And my average accuracy increased 0.001%? And both are highly statistically-significant (not a surprise, given how many entries there were)? What’s going on - this is the exact opposite of expected! The key is the low mean of the before data: I type much faster than 82 WPM now, more like 90 or 100 WPM. What happened was that I spent 3 years practicing. Given that I was improving, it is wrong to compare the recent treadmill typing data against a low long-run average without any consideration of this trend of increasing WPM. What would be better would be to lop off the first half of the before data to get a fairer comparison with after, since I began to plateau around then. Redoing the tests:
secondHalf <- amphetype[(nrow(amphetype)/2):nrow(amphetype),]
l2 <- lm(cbind(WPM, Accuracy) ~ Treadmill, data=secondHalf)
summary(l2)
#
# Coefficients:
#             Estimate Std. Error t value Pr(>|t|)
# (Intercept)   85.826      0.315  272.13  < 2e-16
# Treadmill      1.733      0.494    3.51  0.00047
#
#
# Response Accuracy :
#
# Coefficients:
#             Estimate Std. Error t value Pr(>|t|)
# (Intercept) 0.988951   0.000259 3820.00   <2e-16
# Treadmill   0.000176   0.000406    0.43     0.66
This is more reasonable: only a 2 WPM gain from the treadmill. 2 WPM could be explicable as just a placebo effect: me wanting to justify the time I’ve sunk into the treadmill and typing practice every day. It’s still a little surprising, but the result initially seems solider. (If we drop every score before 2000 instead of 1144, the difference continues to shrink but still favors the treadmill. We have to go to scores 2100-2285 before the treadmill starts to lose, but with 2200-2285 the treadmill wins!) Accuracy seems largely unaffected. Better yet, we can model the linear progress of my WPM over time and test for a variation that way:
amphetype$Nth <- 1:nrow(amphetype)
summary(lm(cbind(WPM, Accuracy) ~ Nth + Treadmill, data=amphetype))
# Response WPM :
#
# Coefficients:
#             Estimate Std. Error t value Pr(>|t|)
# (Intercept) 77.06152    0.37071  207.88   <2e-16
# Nth          0.00462    0.00028   16.49   <2e-16
# Treadmill   -1.41533    0.57651   -2.45    0.014
#
# Response Accuracy :
#
# Coefficients:
#              Estimate Std. Error t value Pr(>|t|)
# (Intercept)  9.86e-01   3.35e-04 2938.81  < 2e-16
# Nth          1.63e-06   2.54e-07    6.44  1.4e-10
# Treadmill   -7.34e-04   5.22e-04   -1.41     0.16
This is more as expected: so walking on the treadmill cost me -1.5WPM in typing speed, and a day of practice correlates with +0.004WPM (and so a full month of practice would be worth 0.12WPM). Having reached diminishing returns, I decided to stop typing practice.
Treadmill Effect on Spaced Repetition Performance: Randomized Experiment
It has been claimed that doing spaced repetition review while on a walking treadmill improves memory performance. I did a randomized experiment 2013-08–2014-05 and found that using a treadmill damaged my recall performance.
Background
Starting in 2010, Seth Roberts claimed that he found his Anki flashcard reviews (for spaced repetition) to be easier & better when he did them while using his treadmill, and offers some just-so evolutionary psychology theorizing that walking may cue knowledge absorption in a “thirst for knowledge”. He doesn’t offer any hard data, but he does quote some data from a 2012 presentation by Jeremy Howard, who claims a 5% review error-rate while walking and 8% while not-walking, and to be “40% faster [at learning]”; a near-halving of lower grades is certainly an effect to be reckoned with and well worthwhile.
An effect strikes me as plausible: flashcard review does not require fine motor skills or (too) difficult thinking, and the walking might well wake one up if nothing else. And it would be convenient if it were true, since spaced repetition on one’s treadmill would be two birds with one stone.
But on the other hand, the walking might be a distraction from the work of recall and damage real performance, much like how many students claim playing music while studying “helps them focus” which is dubious (eg. 2012 found music damaged memory recall, and music you enjoyed was the worst). Consistent with this, my own experience with treadmills was that it impeded concentration. And I couldn’t help but notice Robert’s failure to present hard data: since Anki (like almost all spaced-repetition software), records detailed statistics about flashcard reviews in order to implement the scheduling algorithm, he had access to the data to show some objective performance measurements like whether days on the treadmill increase the average flashcard scores; all he had to do was record his treadmill use and then extract it, which wouldn’t take too long to show “a big effect” (a month or two would likely be enough). But as far as I know, he never made any use of his Anki data.
Having acquired a treadmill, and being a long-time user of Mnemosyne, this seems eminently testable! I simply randomize whether I do my daily Mnemosyne review before or after getting on the treadmill. (Unfortunately, I can think of no way to blind treadmill use, so randomization is it.)
One concern, prompted by the 2013 Lewis meditation results, is that there may be time-of-day effects on flashcard review; I tend to not use the treadmill in the morning (I am not a morning person), so if recall improved in the afternoon, then it might be conflated with the treadmill. I downloaded the 4GB public Mnemosyne dataset (every Mnemosyne user is offered the option to anonymously submit statistical data about their flashcards) to try to analyze it and estimate fixed effects of time. The full dataset showed many such effects, so time variables will be included in the analysis.
Method
Each day I decided to do spaced repetition, I randomly flipped a bit (50-50) in Bash to determine whether I would do it seated or on my treadmill (which is set to 1mph), and recorded whether that day was treadmill-affected after review. This was done from August 2013 to May 2014. Eventually I noticed that the experiment was becoming a trivial inconvenience that was damaging my hard-earned spaced repetition habit, and ended the experiment. I didn’t do a formal power analysis, but my intuition was that this would be enough data to show an effect, especially if the effect was as large as claimed.
The endpoint is the grades given flashcards each day (measuring retrieval of the memory), and the next grade for each flashcard (partially measuring encoding of the same memory), controlling for easiness (a parameter associated with each flashcard by the SRS estimating how hard to remember the flashcard is and when it should next be reviewed), how long since last review, how long spent on each card, day, day of week, & hour of day.
Data
Extract and process:
target <- "~/.local/share/mnemosyne/default.db"
library(sqldf)
# .schema log
# CREATE TABLE log(
#         _id integer primary key autoincrement,
#         event_type integer,
#         timestamp integer,
#         object_id text,
#         grade integer,
#         easiness real,
#         acq_reps integer,
#         ret_reps integer,
#         lapses integer,
#         acq_reps_since_lapse integer,
#         ret_reps_since_lapse integer,
#         scheduled_interval integer,
#         actual_interval integer,
#         thinking_time integer,
#         next_rep integer,
#         scheduler_data integer
#     );
grades <- sqldf("SELECT timestamp,object_id,grade,easiness,thinking_time,actual_interval,(SELECT grade FROM log AS log2 WHERE log2.object_id = log.object_id AND log2.timestamp > log.timestamp ORDER BY log2.timestamp DESC LIMIT 1) AS grade_future FROM log WHERE event_type==9;",
                dbname=target,
                method = c("integer", "factor","integer","numeric","integer","integer", "integer"))
grades$timestamp <- as.POSIXct(grades$timestamp, origin = "1970-01-01", tz = "EST")
grades$thinking_time.log <- log1p(grades$thinking_time); grades$thinking_time <- NULL
colnames(grades) <- c("Timestamp", "ID", "Grade", "Easiness", "Interval.length", "Grade.future", "Thinking.time.log")
## extract the temporal covariates from the timestamp
grades$WeekDay <- as.factor(weekdays(grades$Timestamp))
grades$Hour    <- as.factor(as.numeric(format(grades$Timestamp, "%H")))
grades$Date    <- as.Date(grades$Timestamp)
## select data from during the experiment
treadmill <- grades[grades$Date > as.Date("2013-08-22") &
                    grades$Date < as.Date("2014-06-01"),]

## code which days' review was done on the treadmill
treadmill$Treadmill <- FALSE
treadmillDates <- as.Date(c("2013-08-25", "2013-08-26", "2013-08-28", "2013-09-14", "2013-09-27",
                            "2013-10-14", "2013-11-09", "2013-11-10", "2013-11-14", "2013-11-29",
                            "2013-12-05", "2013-12-07", "2014-01-29", "2014-02-10", "2014-02-15",
                            "2014-02-25", "2014-02-28", "2014-03-04", "2014-03-05", "2014-03-07",
                            "2014-03-09", "2014-03-19", "2014-03-19", "2014-03-24", "2014-03-25",
                            "2014-03-26", "2014-04-03", "2014-04-22", "2014-05-01", "2014-05-05",
                            "2014-05-06", "2014-05-28", "2014-05-29", "2014-05-31"))
for (i in 1:length(treadmillDates)) { treadmill[treadmill$Date==treadmillDates[i],]$Treadmill <- TRUE; }
## serialize clean CSV for analysis
write.csv(treadmill, "~/wiki/doc/psychology/spaced-repetition/2014-05-31-mnemosyne-treadmill.csv", row.names=FALSE)
Analysis
Exploratory
treadmill <- read.csv("https://gwern.net/doc/psychology/spaced-repetition/2014-05-31-mnemosyne-treadmill.csv")
summary(treadmill)
#               Timestamp                         ID           Grade            Easiness
# 2013-11-26 19:24:44:   2   JdjSf1pppya0onAIPxTQH2:   7   Min.   :2.00000   Min.   :1.30000
# 2013-11-26 22:22:12:   2   2UiZC5RXFG8BnuCvMwtrHm:   6   1st Qu.:4.00000   1st Qu.:1.43625
# 2013-12-01 18:21:49:   2   8IbavAIp51TfEZBImDfUL8:   6   Median :4.00000   Median :1.92900
# 2013-12-01 18:22:04:   2   BuMaMeubP2hb1ZbPeKZirj:   6   Mean   :3.77776   Mean   :1.87486
# 2013-08-23 22:56:28:   1   C3IyssfGfLfdgkIjNu3jKN:   6   3rd Qu.:4.00000   3rd Qu.:2.16275
# 2013-08-23 22:56:36:   1   I55jUu4zlCsrT5CGnCYOJ4:   6   Max.   :5.00000   Max.   :3.00000
# (Other)            :5844   (Other)               :5817
# Interval.length      Grade.future     Thinking.time.log        WeekDay          Hour
# Min.   :        0   Min.   :0.00000   Min.   :0.0000000   Friday   : 577   Min.   : 9.0000
# 1st Qu.: 26306332   1st Qu.:4.00000   1st Qu.:0.0000000   Monday   : 711   1st Qu.:15.0000
# Median : 44806694   Median :4.00000   Median :0.0000000   Saturday : 857   Median :17.0000
# Mean   : 44591080   Mean   :3.72783   Mean   :0.0391548   Sunday   : 869   Mean   :17.1727
# 3rd Qu.: 64373024   3rd Qu.:4.00000   3rd Qu.:0.0000000   Thursday :1034   3rd Qu.:20.0000
# Max.   :102203789   Max.   :5.00000   Max.   :4.0253517   Tuesday  :1021   Max.   :23.0000
#                     NA's   :5031                          Wednesday: 785
#         Date      Treadmill
# 2013-09-25: 254   Mode :logical
# 2014-02-10: 171   FALSE:2695
# 2014-02-28: 163   TRUE :3159
# 2013-11-09: 162   NA's :0
# 2013-11-14: 155
# 2014-04-22: 145
# (Other)   :4804

## graphing all 5854 reviews is unreadable, so summarize by day & throw out outliers
daily <- aggregate(Grade ~ Date + Treadmill, treadmill, mean)
daily <- daily[order(daily$Date),]
daily <- daily[daily$Grade>=3 & daily$Grade<=4,]
library(ggplot2)
qplot(Date, Grade, color=Treadmill, size=I(5), data=daily)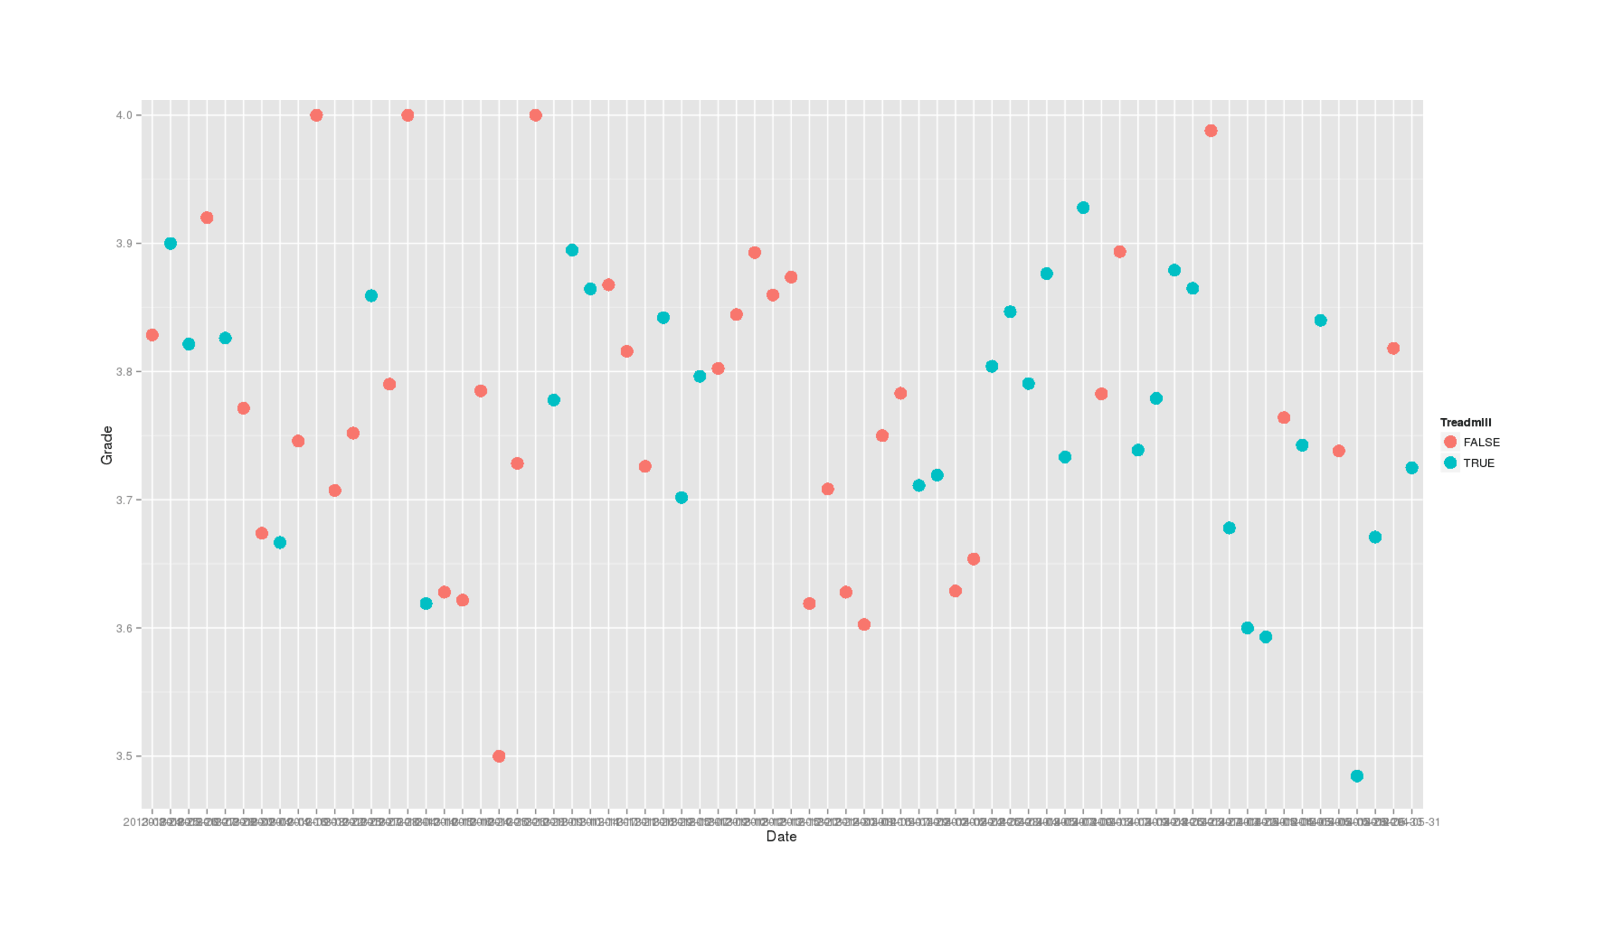
Tests
Because there’s only 4 possible responses in the dataset (2/3/4/5) & they don’t look like a normal distribution (even with n = 5853), my analysis preference is for an ordinal logistic regression which captures that structure; on the other hand, a linear model is easier to work with and it is a lot of data. And because my earlier analysis of the ~50m response Mnemosyne dataset confirmed that there are meaningful hour-of-day and day-of-week effects, I’ll want to include those as covariates. (I was originally going to include card ID as a random-effects variable to reflect the easiness of each card and help reduce the unpredictability of grades; but the most any card had been reviewed during the experiment was 7 times, so the possible gain was limited, and when an analysis with card IDs as a variable took >2 hours to run and still hadn’t finished, I decided to simply use Mnemosyne’s internal estimate of “easiness”.) I’ll first check with a U-test that any effect isn’t being completely driven by the covariates.
wilcox.test(Grade ~ Treadmill, conf.int=TRUE, data=treadmill)
#     Wilcoxon rank sum test with continuity correction
#
# data:  Grade by Treadmill
# W = 4363405, p-value = 0.01796
# alternative hypothesis: true location shift is not equal to 0
# 95 percent confidence interval:
#  -5.93488865e-05  4.90689572e-05
# sample estimates:
# difference in location
#         5.43849586e-05
So there’s a difference between the groups. What difference? I want to look for an effect on the grades given each day, but also an effect on the next grade at the next review of flashcards which are affected (or not) by treadmill use, which is tricky because the first grade for flashcard A is an excellent predictor of its next grade (if I graded a flashcard ‘4’, then probably its next grade will be a ‘4’ too). So Grade is both being predicted by the variables but also is a predictor for Grade.future. There’s 3 ways I can think of to approach this:
-
estimate
GradeandGrade.futurein completely separate regressions;Grade.futuredoes not appear in the first regression estimatingGrade, and in the second one,Grade.future ~ Grade -
treat it as a multivariate multiple regression problem and not try to use
Gradeto predictGrade.future -
improve on #1 and use simultaneous equations: a path model or structural equation modeling
The downside of this is that SEMs, while applicable here and an extremely powerful family of techniques, are notoriously difficult to understand or use. I am not certain that my attempt to use it for this problem is correct.
I’ll present all 3 since they seem to agree.
Separate regressions:
summary(lm(Grade ~ Treadmill + Easiness + Interval.length + Thinking.time.log + WeekDay + Hour, data=treadmill))
## Coefficients:
##                       Estimate   Std. Error  t value   Pr(>|t|)
## (Intercept)        2.80677e+00  6.34044e-02 44.26780 < 2.22e-16
## TreadmillTRUE     -5.10778e-02  1.49802e-02 -3.40970 0.00065475
## Easiness           6.03135e-01  1.74181e-02 34.62681 < 2.22e-16
## Interval.length    1.37417e-09  3.10530e-10  4.42522 9.8095e-06
## Thinking.time.log -7.11363e-02  3.09461e-02 -2.29872 0.02155611
## WeekDayMonday     -7.39220e-02  3.16516e-02 -2.33549 0.01955131
## WeekDaySaturday   -1.42952e-01  3.10946e-02 -4.59732 4.3697e-06
## WeekDaySunday     -2.29438e-02  3.07093e-02 -0.74713 0.45501697
## WeekDayThursday   -4.96342e-02  2.93847e-02 -1.68912 0.09125006
## WeekDayTuesday    -4.78373e-02  2.99313e-02 -1.59824 0.11004403
## WeekDayWednesday  -1.03122e-01  3.14425e-02 -3.27971 0.00104523
## Hour              -7.36549e-03  2.35632e-03 -3.12584 0.00178166
##
## Residual standard error: 0.560091 on 5842 degrees of freedom
## Multiple R-squared:  0.178135,   Adjusted R-squared:  0.176587
summary(lm(Grade.future ~ Grade + Treadmill + Easiness + Interval.length + Thinking.time.log + WeekDay + Hour, data=treadmill))
## Coefficients:
##                       Estimate   Std. Error  t value   Pr(>|t|)
## (Intercept)        4.06756e-01  2.27547e-01  1.78757  0.0742200
## Grade              2.40430e-01  3.31083e-02  7.26192 8.9652e-13
## TreadmillTRUE     -3.38867e-03  3.88392e-02 -0.08725  0.9304954
## Easiness           8.75420e-01  6.95734e-02 12.58269 < 2.22e-16
## Interval.length    2.46084e-08  4.00242e-09  6.14837 1.2281e-09
## Thinking.time.log  2.86484e-01  1.55767e-01  1.83918  0.0662539
## WeekDayMonday      2.38570e-02  8.51907e-02  0.28004  0.7795162
## WeekDaySaturday    2.90015e-02  8.25291e-02  0.35141  0.7253727
## WeekDaySunday     -1.44319e-03  7.16955e-02 -0.02013  0.9839451
## WeekDayThursday    4.10939e-03  7.99399e-02  0.05141  0.9590147
## WeekDayTuesday    -1.32259e-02  8.16232e-02 -0.16204  0.8713175
## WeekDayWednesday   6.06417e-02  8.87476e-02  0.68331  0.4946093
## Hour               1.90015e-02  6.03937e-03  3.14627  0.0017141
##
## Residual standard error: 0.529701 on 810 degrees of freedom
##   (5031 observations deleted due to missingness)
## Multiple R-squared:  0.412783,   Adjusted R-squared:  0.404084
Multivariate:
summary(lm(cbind(Grade, Grade.future) ~ Treadmill + Easiness + Interval.length + Thinking.time.log + WeekDay + Hour, data=treadmill))
# Grade:
## ...Coefficients:
##                       Estimate   Std. Error  t value   Pr(>|t|)
## (Intercept)        2.78720e+00  2.20601e-01 12.63457 < 2.22e-16
## TreadmillTRUE     -1.71331e-01  4.07513e-02 -4.20430 2.9103e-05
## Easiness           8.33584e-01  6.77357e-02 12.30642 < 2.22e-16
## Interval.length   -1.38508e-08  4.21703e-09 -3.28449 0.00106550
## Thinking.time.log -2.64515e-01  1.64946e-01 -1.60365 0.10918153
## WeekDayMonday     -4.32958e-01  8.90653e-02 -4.86113 1.4016e-06
## WeekDaySaturday   -4.38449e-01  8.61660e-02 -5.08843 4.4891e-07
## WeekDaySunday     -2.56739e-01  7.55042e-02 -3.40033 0.00070594
## WeekDayThursday   -4.50507e-01  8.32957e-02 -5.40853 8.3666e-08
## WeekDayTuesday    -3.09444e-01  8.58852e-02 -3.60299 0.00033374
## WeekDayWednesday  -4.07119e-01  9.30340e-02 -4.37602 1.3665e-05
## Hour              -1.80859e-02  6.37381e-03 -2.83754 0.00465974
##
## Residual standard error: 0.561802 on 811 degrees of freedom
##   (5031 observations deleted due to missingness)
## Multiple R-squared:  0.48334,    Adjusted R-squared:  0.476332
# Grade.future:
## ...Coefficients:
##                       Estimate   Std. Error  t value   Pr(>|t|)
## (Intercept)        1.07688e+00  2.14528e-01  5.01978 6.3617e-07
## TreadmillTRUE     -4.45816e-02  3.96293e-02 -1.12497   0.260936
## Easiness           1.07584e+00  6.58709e-02 16.33255 < 2.22e-16
## Interval.length    2.12782e-08  4.10093e-09  5.18864 2.6787e-07
## Thinking.time.log  2.22887e-01  1.60405e-01  1.38953   0.165052
## WeekDayMonday     -8.02389e-02  8.66132e-02 -0.92640   0.354511
## WeekDaySaturday   -7.64148e-02  8.37937e-02 -0.91194   0.362071
## WeekDaySunday     -6.31709e-02  7.34254e-02 -0.86034   0.389855
## WeekDayThursday   -1.04206e-01  8.10024e-02 -1.28645   0.198652
## WeekDayTuesday    -8.76254e-02  8.35206e-02 -1.04915   0.294423
## WeekDayWednesday  -3.72417e-02  9.04726e-02 -0.41164   0.680716
## Hour               1.46531e-02  6.19833e-03  2.36404   0.018312
##
## Residual standard error: 0.546335 on 811 degrees of freedom
##   (5031 observations deleted due to missingness)
## Multiple R-squared:  0.374552,   Adjusted R-squared:  0.366069
SEM (using lavaan):
library(lavaan)
Mnemo.model <- '
                Grade ~ Treadmill + Easiness + Interval.length + Thinking.time.log + WeekDay + Hour
                Grade.future ~ Grade + Treadmill + Easiness + Interval.length + Thinking.time.log + WeekDay + Hour
               '
Mnemo.fit <- sem(model = Mnemo.model, data = treadmill)
summary(Mnemo.fit)
## ...                Estimate  Std.err  Z-value  P(>|z|)
## Regressions:
##   Grade ~
##     Treadmill        -0.169
##     Easiness          0.832
##     Intervl.lngth    -0.000
##     Thinkng.tm.lg    -0.289
##     WeekDay          -0.027
##     Hour             -0.007
##   Grade.future ~
##     Grade             0.238
##     Treadmill        -0.000
##     Easiness          0.877
##     Intervl.lngth     0.000
##     Thinkng.tm.lg     0.288
##     WeekDay           0.001
##     Hour              0.018
##
## Variances:
##     Grade             0.324
##     Grade.future      0.277
In each of the 3 approaches, the estimated effect of treadmill usage on my Mnemosyne scores that day was negative but after incorporating the negative effect of poorer recall that day, there did not seem to be additional damage above and beyond that.
Conclusion
While the result seems highly likely to be true for me, I don’t know how well it might generalize to other people. For example, perhaps more fit people can use a treadmill without harm and the negative effect is due to the treadmill usage tiring & distracting me; I try to walk 2 miles a day, but that’s not much compared to some people.
Given this harmful impact, I will avoid doing spaced repetition on my treadmill in the future, and given this & the typing result, will relegate any computer+treadmill usage to non-intellectually-demanding work like watching movies. This turned out to not be a niche use I cared about and I hardly ever used my treadmill afterwards, so in October 2016 I sold my treadmill for $70. I might investigate standing desks next for providing some exercise beyond sitting but without the distracting movement of walking on a treadmill.